Daniel Strmečki
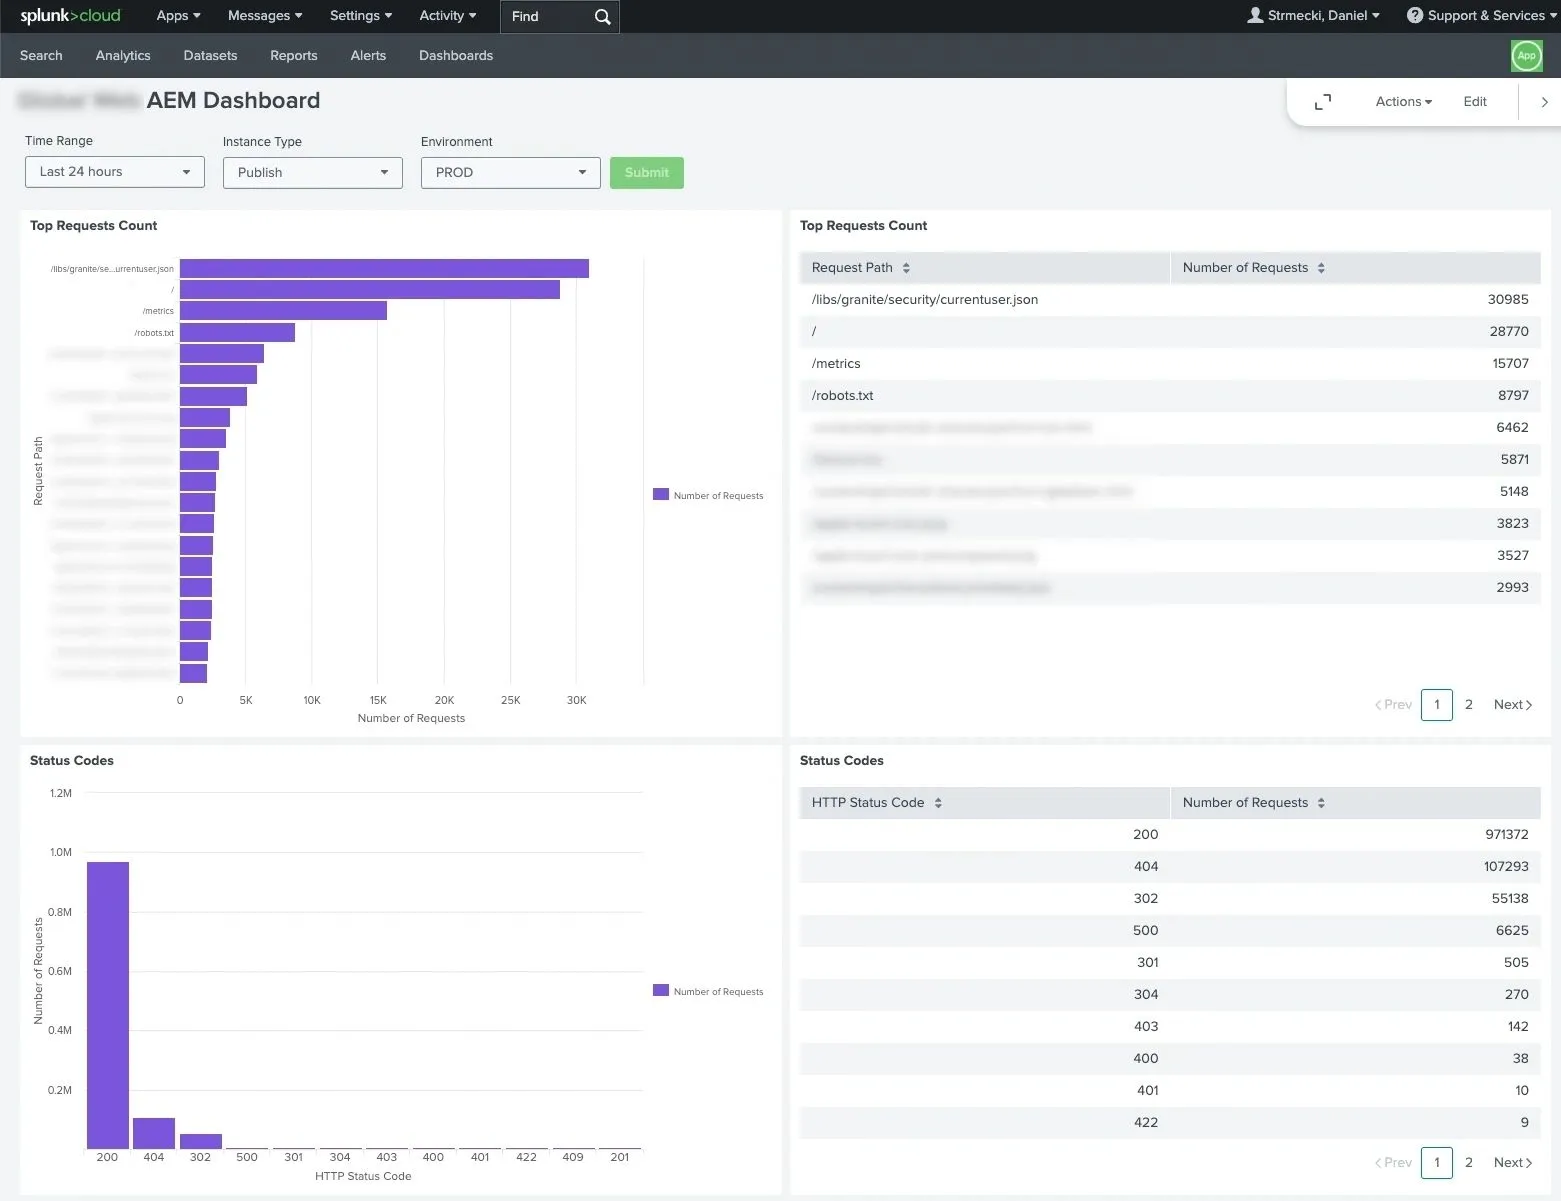
AEMaaCS customers and development teams with Splunk accounts can have their AEMaaCS logs forwarded to a designated Splunk index. The log data is the same as what's available via Cloud Manager downloads, but Splunk’s query features may offer added convenience. The ability to query logs is great for debugging specific issues, but Splunk can offer us more in terms of observability and alerting. In this article, we'll walk through setting up a dashboard for monitoring AEM. We'll be sharing some useful Splunk queries that can be easily reused for creating dashboards and reports. Splunk reports can be scheduled for delivery to the development teams via email or Slack to identify and fix issues as soon as possible, ideally even before users report them.
Setup Dashboard
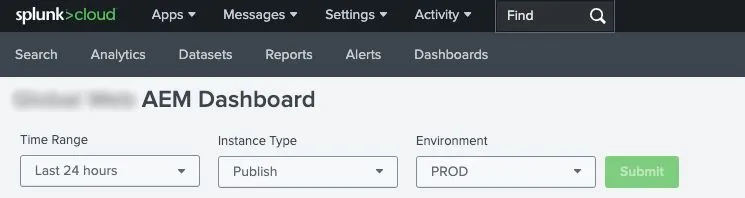
Creating a new Dashboard in Splunk can be done via a simple drag-and-drop interface. Throughout this article, we'll create different visualizations based on Splunk queries. However, we'll start by creating three simple input fields on our dashboard to ensure that our dashboard and its visualizations can be used for all our AEMaaCS environments, instance types, and time ranges. We should note that these inputs will be used as variables later in our Splunk queries, for example, the selected environment is available via the $environment$ variable.
Top Errors
The first visualization we'll create is the one that shows the most common errors appearing in our AEM error logs. It is important to constantly monitor and fix new errors, warnings, and exceptions. As most of the time we don't have the luxury to fix all of them, we should prioritize the ones that happen most often.
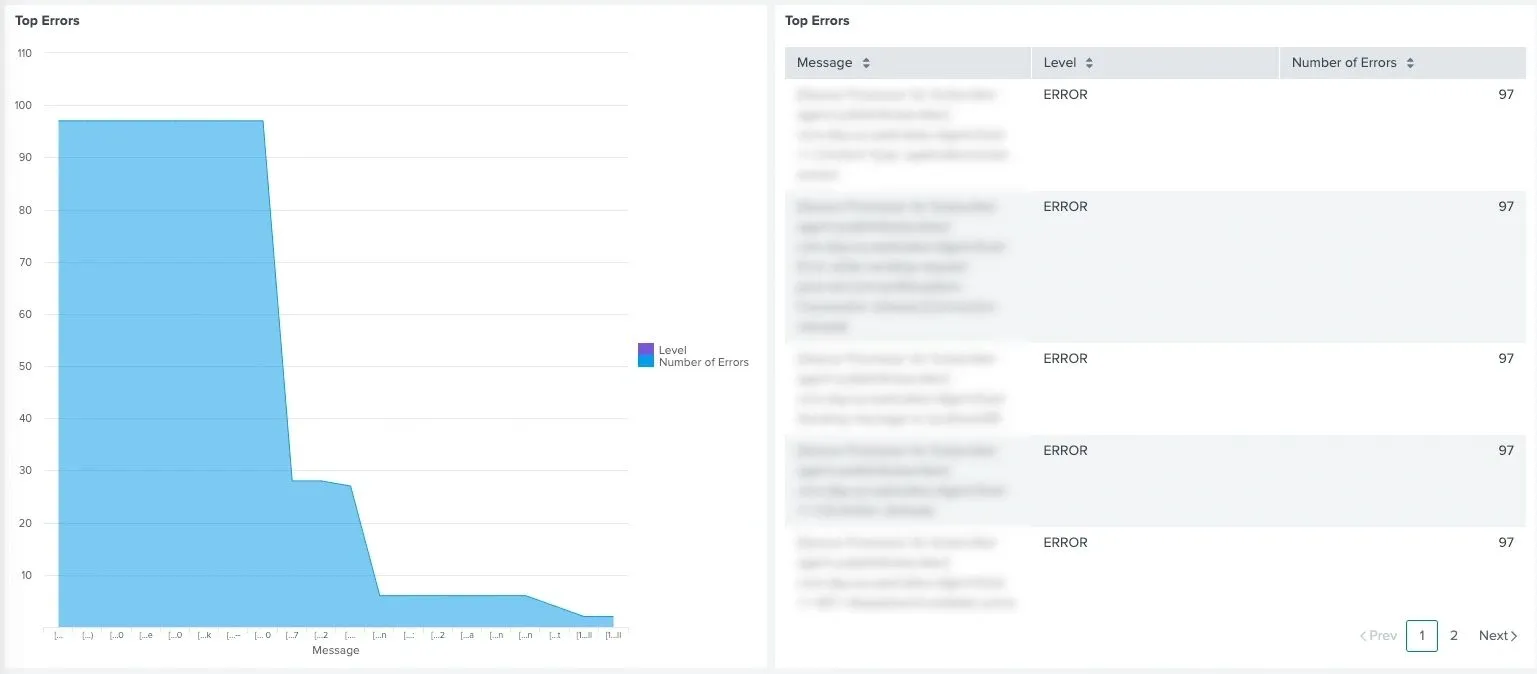
Here is the Splunk query used for visualizing the top 20 AEM logged errors:
index=replace_with_your_index sourcetype=aemerror aem_tier=$instance_type$ aem_env_id=$environment$ level=ERROR
| eval msg = substr(msg, 1, 500)
| stats count by msg, level
| sort -count
| rename level AS "Level"
| rename msg AS "Message"
| rename count AS "Number of Errors"
| head 20
A similar query can be used to visualize the top 20 Dispatcher logged errors:
index=replace_with_your_index sourcetype=httpderror aem_tier=publish aem_env_id=$environment$
| stats count by message, level
| sort -count
| rename level AS "Level"
| rename message AS "Message"
| rename count AS "Number of Errors"
| head 20
Status Codes
Next, we'll create a simple visualization that displays the number of requests that received a specific HTTP response code. This visualization is useful for monitoring the amount of redirects or server error responses. Hopefully, we know what to expect in this report and can monitor it for spikes that require further investigation.
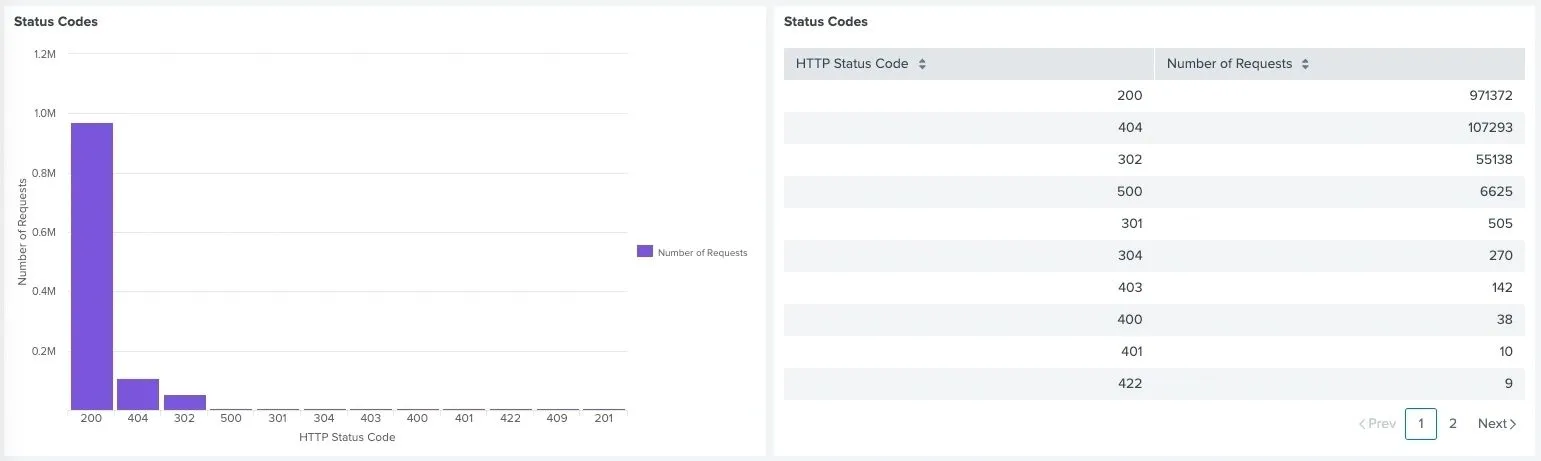
Here is the Splunk query used for visualizing the number of AEM responses with particular HTTP status codes:
index=replace_with_your_index sourcetype=aemrequest aem_tier=$instance_type$ aem_env_id=$environment$
| stats count by code
| sort -count
| rename code AS "HTTP Status Code"
| rename count AS "Number of Requests"
A similar query can be used to visualize the number of Dispatcher responses with particular HTTP status codes:
index=replace_with_your_index sourcetype=httpdaccess NOT path="/server-status/?auto" NOT path="/system/probes/*" aem_tier=publish aem_env_id=$environment$
| stats count by code
| sort -count
| rename code AS "HTTP Status Code"
| rename count AS "Number of Requests"
Top Requests
The next visualization we'll create is for monitoring paths that receive the highest number of requests. Using this visualization we can quickly observe if certain paths are receiving significantly more traffic than we expect. It can help us identify wrong client-side implementations of server-side APIs or mistakes in the cache configuration.
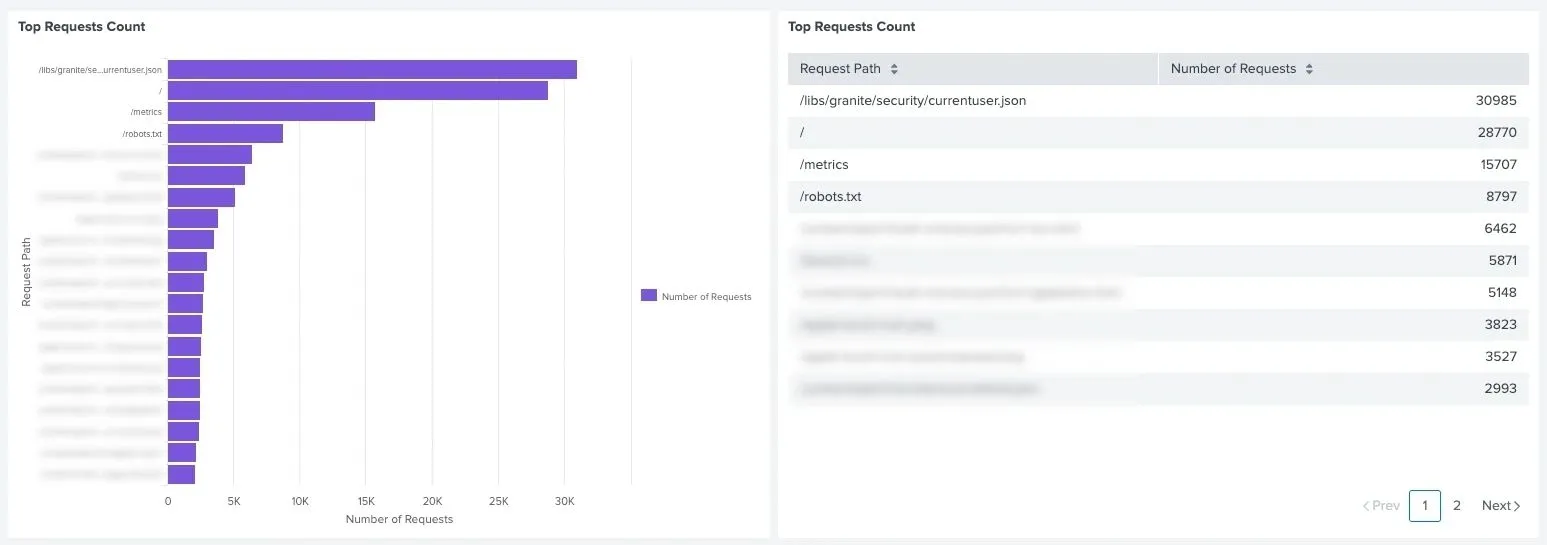
Here is the Splunk query used for visualizing the number of top AEM requests toward the same path:
index=replace_with_your_index sourcetype=aemrequest aem_tier=$instance_type$ aem_env_id=$environment$
| stats count by path
| sort -count
| rename count AS "Number of Requests"
| rename path AS "Request Path"
| head 20
A similar query can be used to visualize the number of top Dispatcher requests toward the same path:
index=replace_with_your_index sourcetype=httpdaccess NOT path="/server-status/?auto" NOT path="/system/probes/*" aem_tier=publish aem_env_id=$environment$
| stats count by path
| sort -count
| rename count AS "Number of Requests"
| rename path AS "Request Path"
| head 20
Slowest Requests
Finally, we'll create a visualization that displays paths with the slowest response times. Slow response times are a usual indicator of wrong or not optimized backend implementations. This Splunk query is the trickiest, as it requires merging two events from the request log to grab all the required data. However, it might also be the most useful one, as it gives us a clear answer on which APIs or pages are slow and where we should focus our optimization efforts.
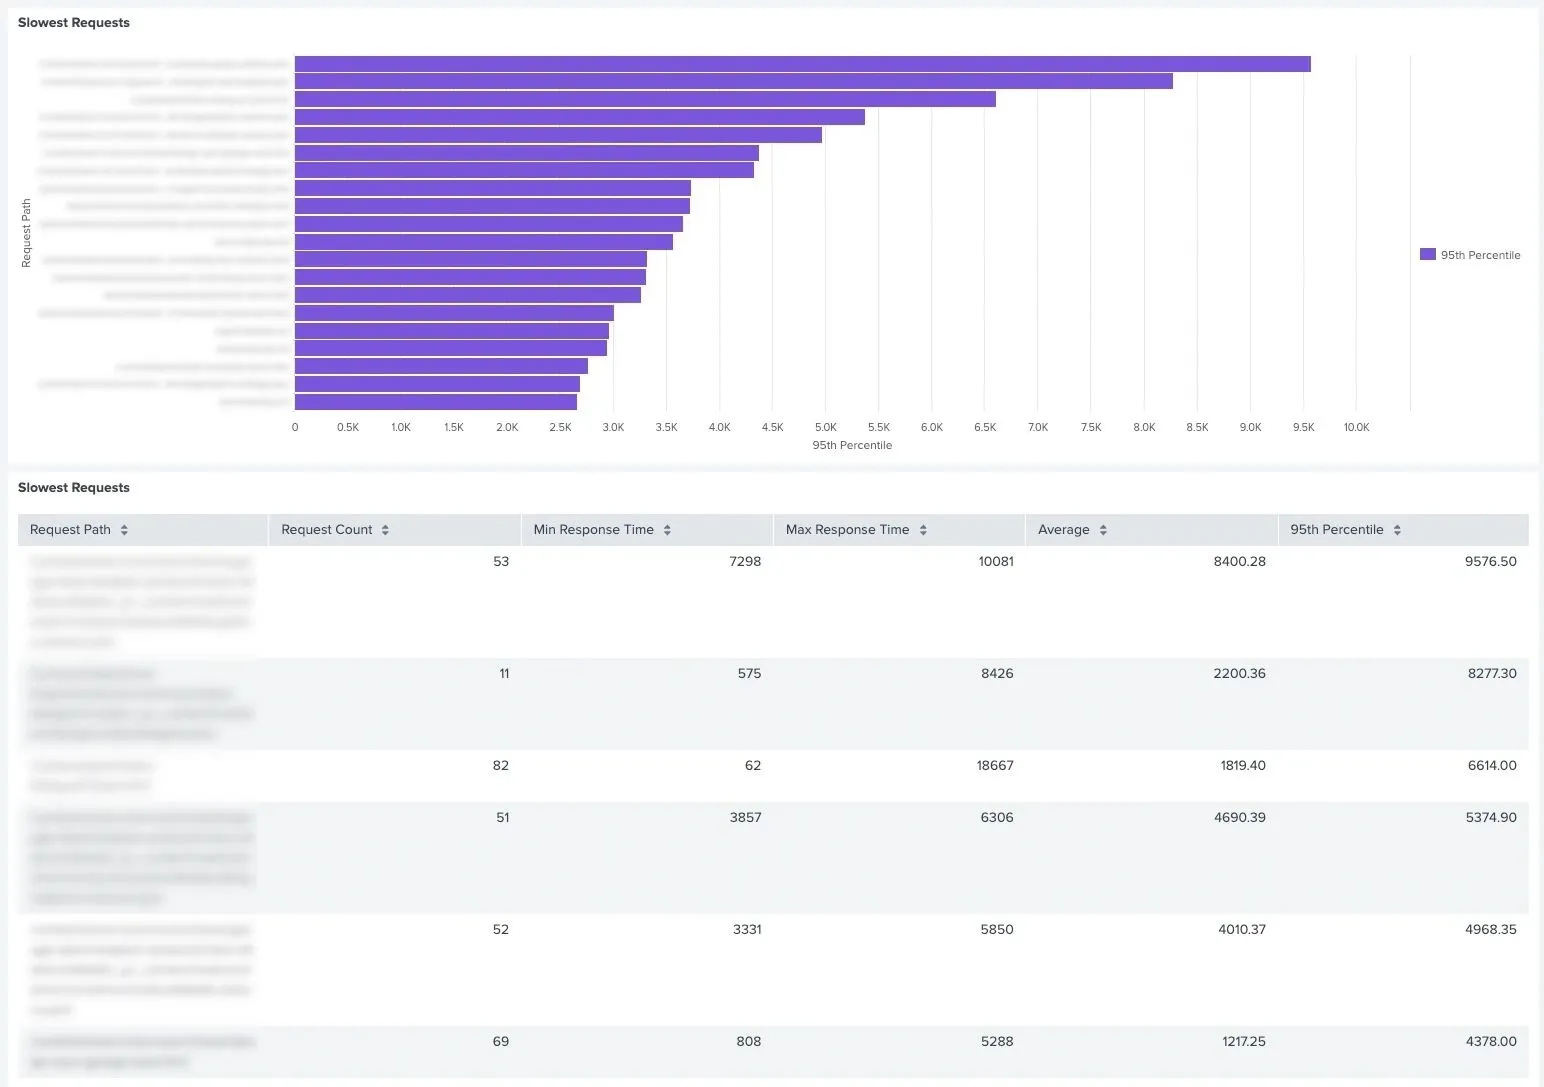
Here is the Splunk query used for visualizing the slowest response times toward the same path:
index=replace_with_your_index sourcetype=aemrequest aem_tier=$instance_type$ aem_env_id=$environment$
| eventstats first(path) as path, first(response_time) as response_time by request_id, pod_name
| table request_id pod_name path, response_time
| stats count as request_count, min(response_time) as min_response_time, max(response_time) as max_response_time, perc95(response_time) as p95_response_time, avg(response_time) as avg_response_time by path
| eval request_count = request_count/2
| eval p95_response_time=round(p95_response_time,2)
| eval avg_response_time=round(avg_response_time,2)
| table path, request_count, min_response_time, max_response_time, avg_response_time, p95_response_time
| where request_count > 10
| sort -p95_response_time
| rename path AS "Request Path"
| rename request_count AS "Request Count"
| rename min_response_time AS "Min Response Time"
| rename max_response_time AS "Max Response Time"
| rename p95_response_time AS "95th Percentile"
| rename avg_response_time AS "Average"
| head 20
Conclusion
One might wonder why we need dashboards and reports in Splunk, as Adobe provides us with access to New Relic APM. The truth is that New Relic is great, but AEMaaCS only offers the New Relic APM view permissions for customers and does not provide support for alerting or logging. Therefore, we can compensate for the lack of mentioned features in New Relic with Splunk. Log analysis and proactive alerting are a must-have feature for every long-term enterprise project. I hope you find our examples useful and that they help you set up better monitoring over your AEMaaCS instances. In case you haven't used such reports before, you might be surprised by the number of findings. Don't get overwhelmed in case you find a lot of issues, every project has them. It is important to identify the most important ones and address them in small steps. A good development practice is to add 2-3 technical debt tickets into each iteration. This approach helps to ensure project stability and long-term success.