Index Traversal in AEM: A Common Source of Performance Issues
 Daniel Strmečki
Index traversal is one of the most common and most misunderstood causes of performance issues in Adobe Experience Manager (AEM). It rarely appears during local development or early project phases, but tends to surface once a system goes live, content volumes grow, and real user traffic starts hitting authoring and delivery workflows. What makes index traversal particularly dangerous is how easy it is to introduce. A single custom JCR query, a reporting feature, or an authoring UI enhancement can quietly trigger queries that scan tens or even hundreds of thousands of nodes. At first, the impact may be barely noticeable. However, over time, content grows, and queries accumulate, increasing CPU usage, slowing down AEM Author, and in the worst cases, destabilizing entire environments.
Because traversal warnings are logged rather than surfaced as functional errors, they are often ignored or misunderstood until performance issues become visible to end users or editors. By then, identifying the root cause can be difficult without proper observability and indexing discipline. This post explains what index traversal is, why it happens when custom queries are introduced, how to detect it in logs, and how to proactively monitor and fix it using proper Oak indexes and Splunk for observability.
What Is Index Traversal
In AEM, all content is stored in a JCR repository backed by Apache Jackrabbit Oak. Query performance depends heavily on indexes. When a query can be answered using an index, Oak can quickly locate matching nodes. When it cannot, Oak falls back to index traversal. Index traversal means that Oak iterates over a large number of nodes, evaluating each one against the query filter. This is an expensive operation in terms of CPU and memory and can quickly degrade both author and publisher performance. Traversal usually appears when:
- Custom JCR-SQL2 or XPath queries are introduced
- Full-text searches are executed without a suitable index
- Queries lack path restrictions or use overly broad predicates
- Queries target properties that are not included in an index
A common real-world example is a query used by custom components, authoring tools, or APIs that scans site content to find pages using specific custom properties. For example, teams may introduce a custom query that searches for components with a specific sling:resourceType or a custom property such as isCustomComponent=true. Without a dedicated index for these properties, Oak has no efficient way to answer the query and instead traverses large portions of the site tree. While Oak does include built-in indexes, they are intentionally generic. As soon as teams introduce custom queries for business logic, reporting, or authoring tools, custom indexes may be needed to ensure optimal performance.
Detecting Index Traversal
AEM logs all index traversal warnings at the WARN level. These log messages can be found in the error.log. They explicitly state how many nodes were traversed, which makes them easy to identify once you know what to look for. Example log entry:
29.01.2026 14:47:23.696 *WARN* com.mycompany.aem.search.CustomComponentQuery: Index-Traversed 78000 nodes with filter Filter(query=select * from [nt:base] as c where isdescendantnode(c, '/content') and c.[sling:resourceType] like 'myproject/components/%' and c.[isCustomComponent] = true, path=/content)Key signals to look for:
- "Index-Traversed" keyword
- Number of traversed nodes
- Query filter that triggered the traversal
In production environments, traversal warnings rarely stand out on their own. They are mixed in with large volumes of error log and operational noise, making them easy to miss unless you are actively looking for them. If you are using Splunk, these warnings can be aggregated and queried, enabling reliable detection of index traversal issues across pods, requests, and environments.
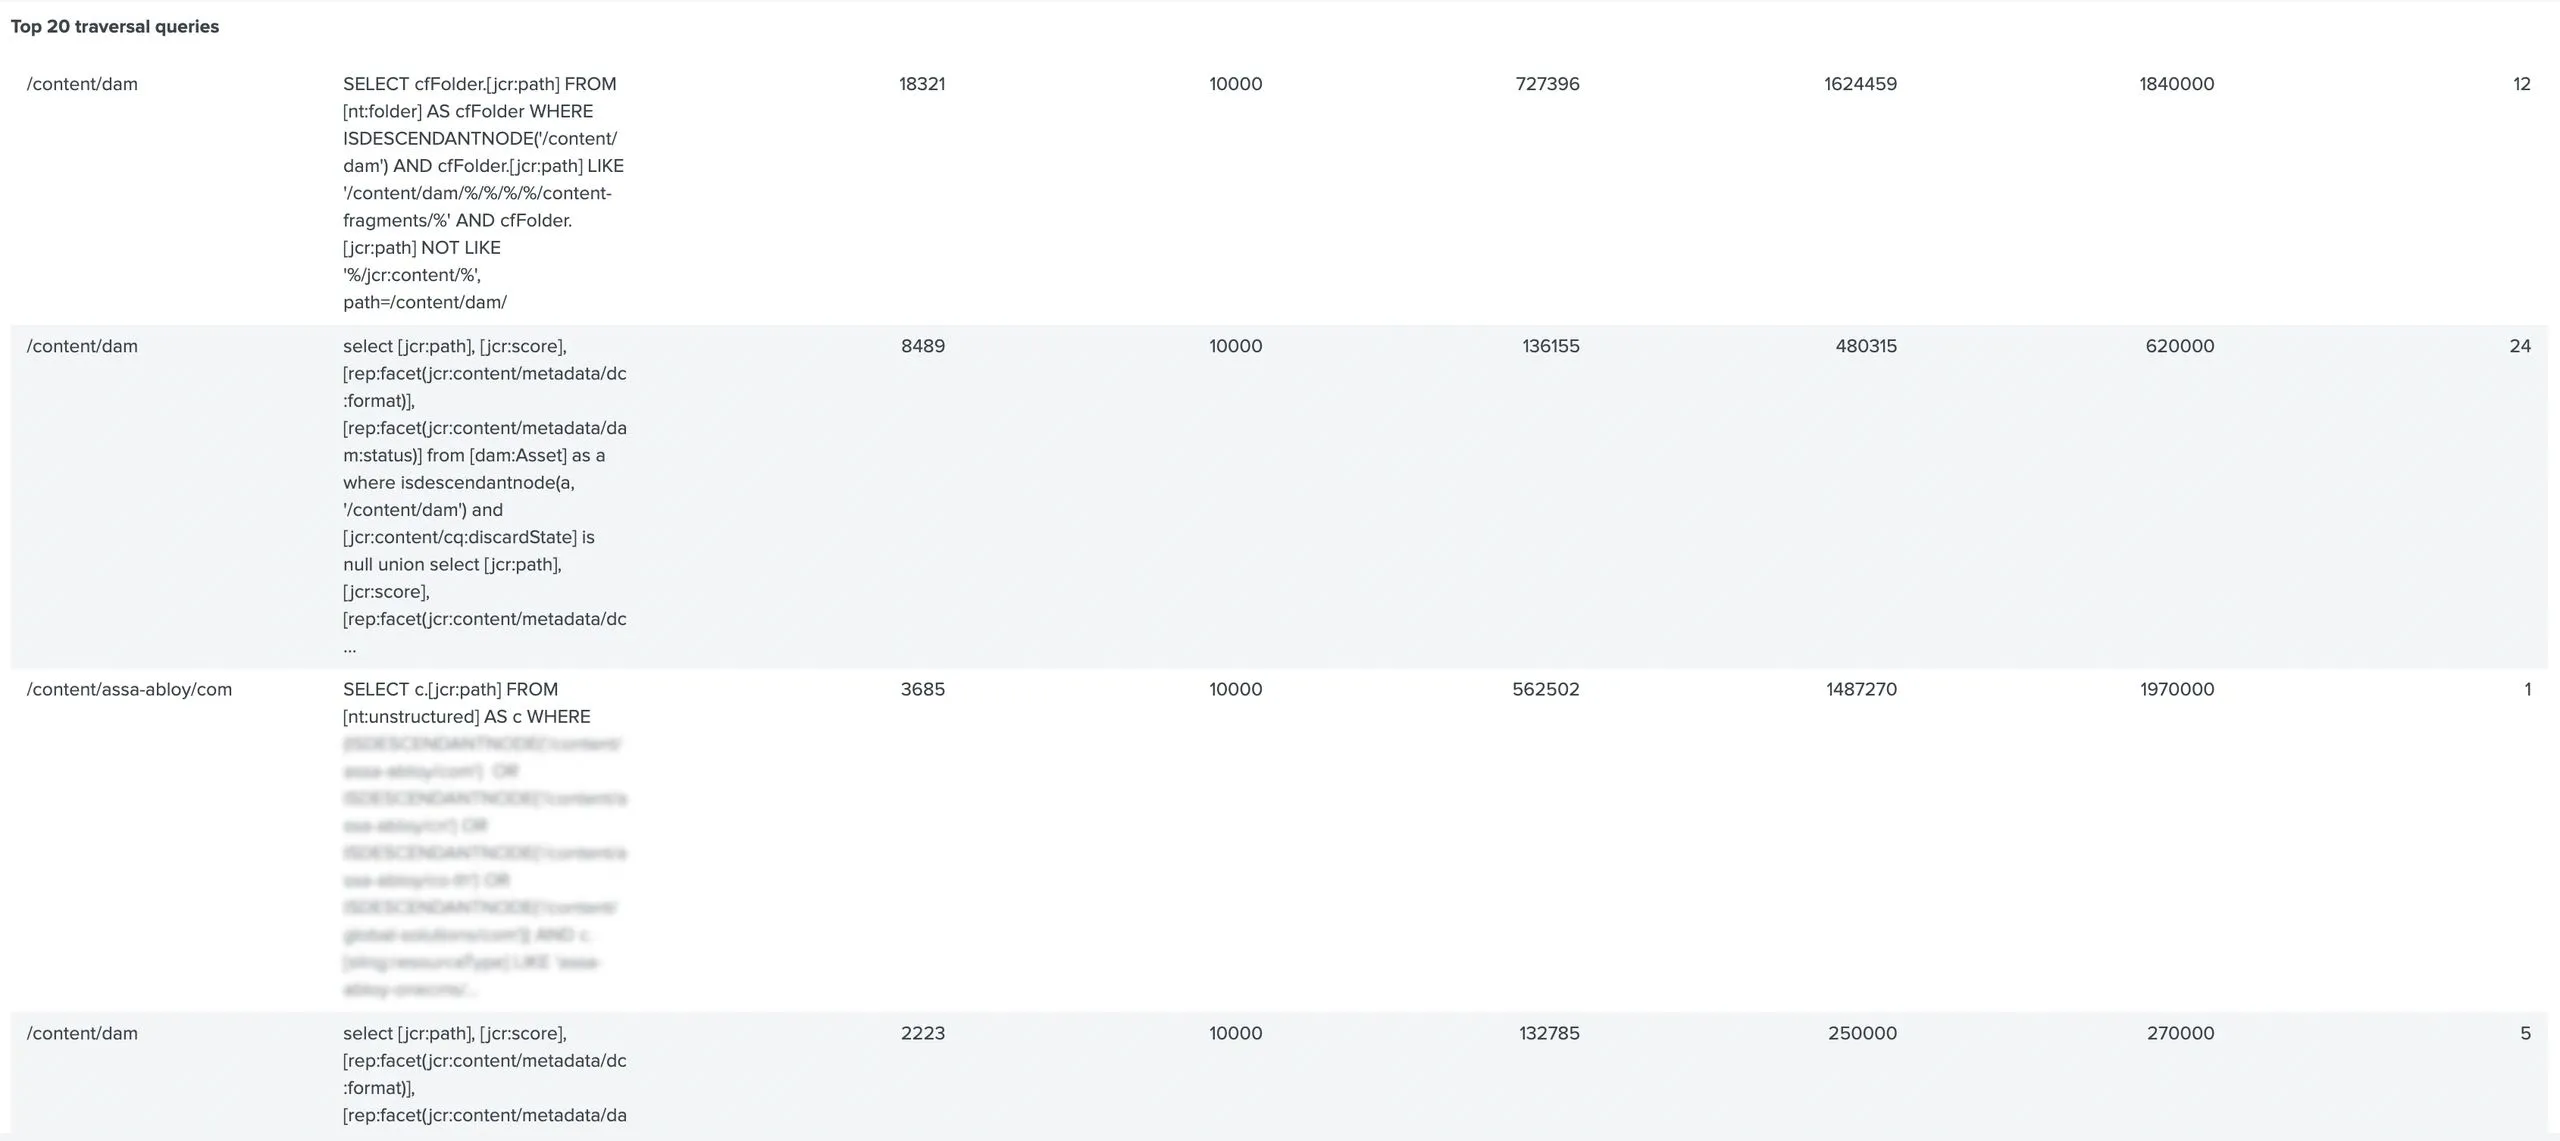
The following Splunk query provides a simple baseline for identifying index traversal warnings in production environments:
index={replace_with_your_index} aem_env_id={replace_with_your_env_id} sourcetype=aemerror aem_env_type=prod level=WARN aem_tier=author "Index-Traversed"Fixing Index Traversal
Index traversal is not always solved by adding an index. In many cases, the simplest fix is to improve the query itself. Common query-level fixes include:
- Adding a tighter path restriction, such as /content/site instead of /content
- Reducing full-text searches in favor of property-based predicates
- Avoiding wildcard searches on large node sets
- Limiting result sets where possible
If a query can be made more selective or scoped more narrowly, traversal can sometimes be eliminated without adding new indexes. However, when a query is valid, intentional, and required for business or authoring needs, adding a new, custom index is the correct solution. In practice, custom index definitions are created under /oak:index JCR node. For component discovery queries under /content, the most important step is to index the properties the query filters on, such as sling:resourceType and isCustomComponent. Here is an example Lucene property index definition in JSON format:
{
  "jcr:primaryType": "oak:QueryIndexDefinition",
  "info": "Index-used-to-search-custom-components",
  "type": "lucene",
  "async": ["async", "nrt"],
  "compatVersion": 2,
  "evaluatePathRestrictions": true,
  "includedPaths": ["/content"],
  "queryPaths": ["/content"],
  "indexRules": {
    "jcr:primaryType": "nt:unstructured",
    "nt:unstructured": {
      "jcr:primaryType": "nt:unstructured",
      "properties": {
        "jcr:primaryType": "nt:unstructured",
        "slingResourceType": {
          "jcr:primaryType": "nt:unstructured",
          "name": "sling:resourceType",
          "propertyIndex": true,
          "type": "String"
        },
        "isCustomComponent": {
          "jcr:primaryType": "nt:unstructured",
          "name": "isCustomComponent",
          "propertyIndex": true,
          "type": "Boolean"
        }
      }
    }
  }
}
Once this index is deployed, traversal warnings should disappear, and node traversal drops dramatically. As a general rule, every intentional, recurring custom query in AEM should either be rewritten to avoid traversal or backed by an index. An important decision to make is whether to add a new custom index or extend an existing OOTB index. For queries targeting dam:Asset nodes, Adobe generally recommends extending the existing out-of-the-box DAM Lucene index rather than creating a completely new one. This helps avoid index proliferation while still allowing teams to safely add the properties required for asset-specific queries.
Explaining Queries
Before adding new indexes or customizing existing ones, it is important to understand how Oak is actually executing the problematic query. Thankfully, AEM provides a built-in tool for this purpose located at: /libs/granite/operations/content/diagnosistools/queryPerformance.html.
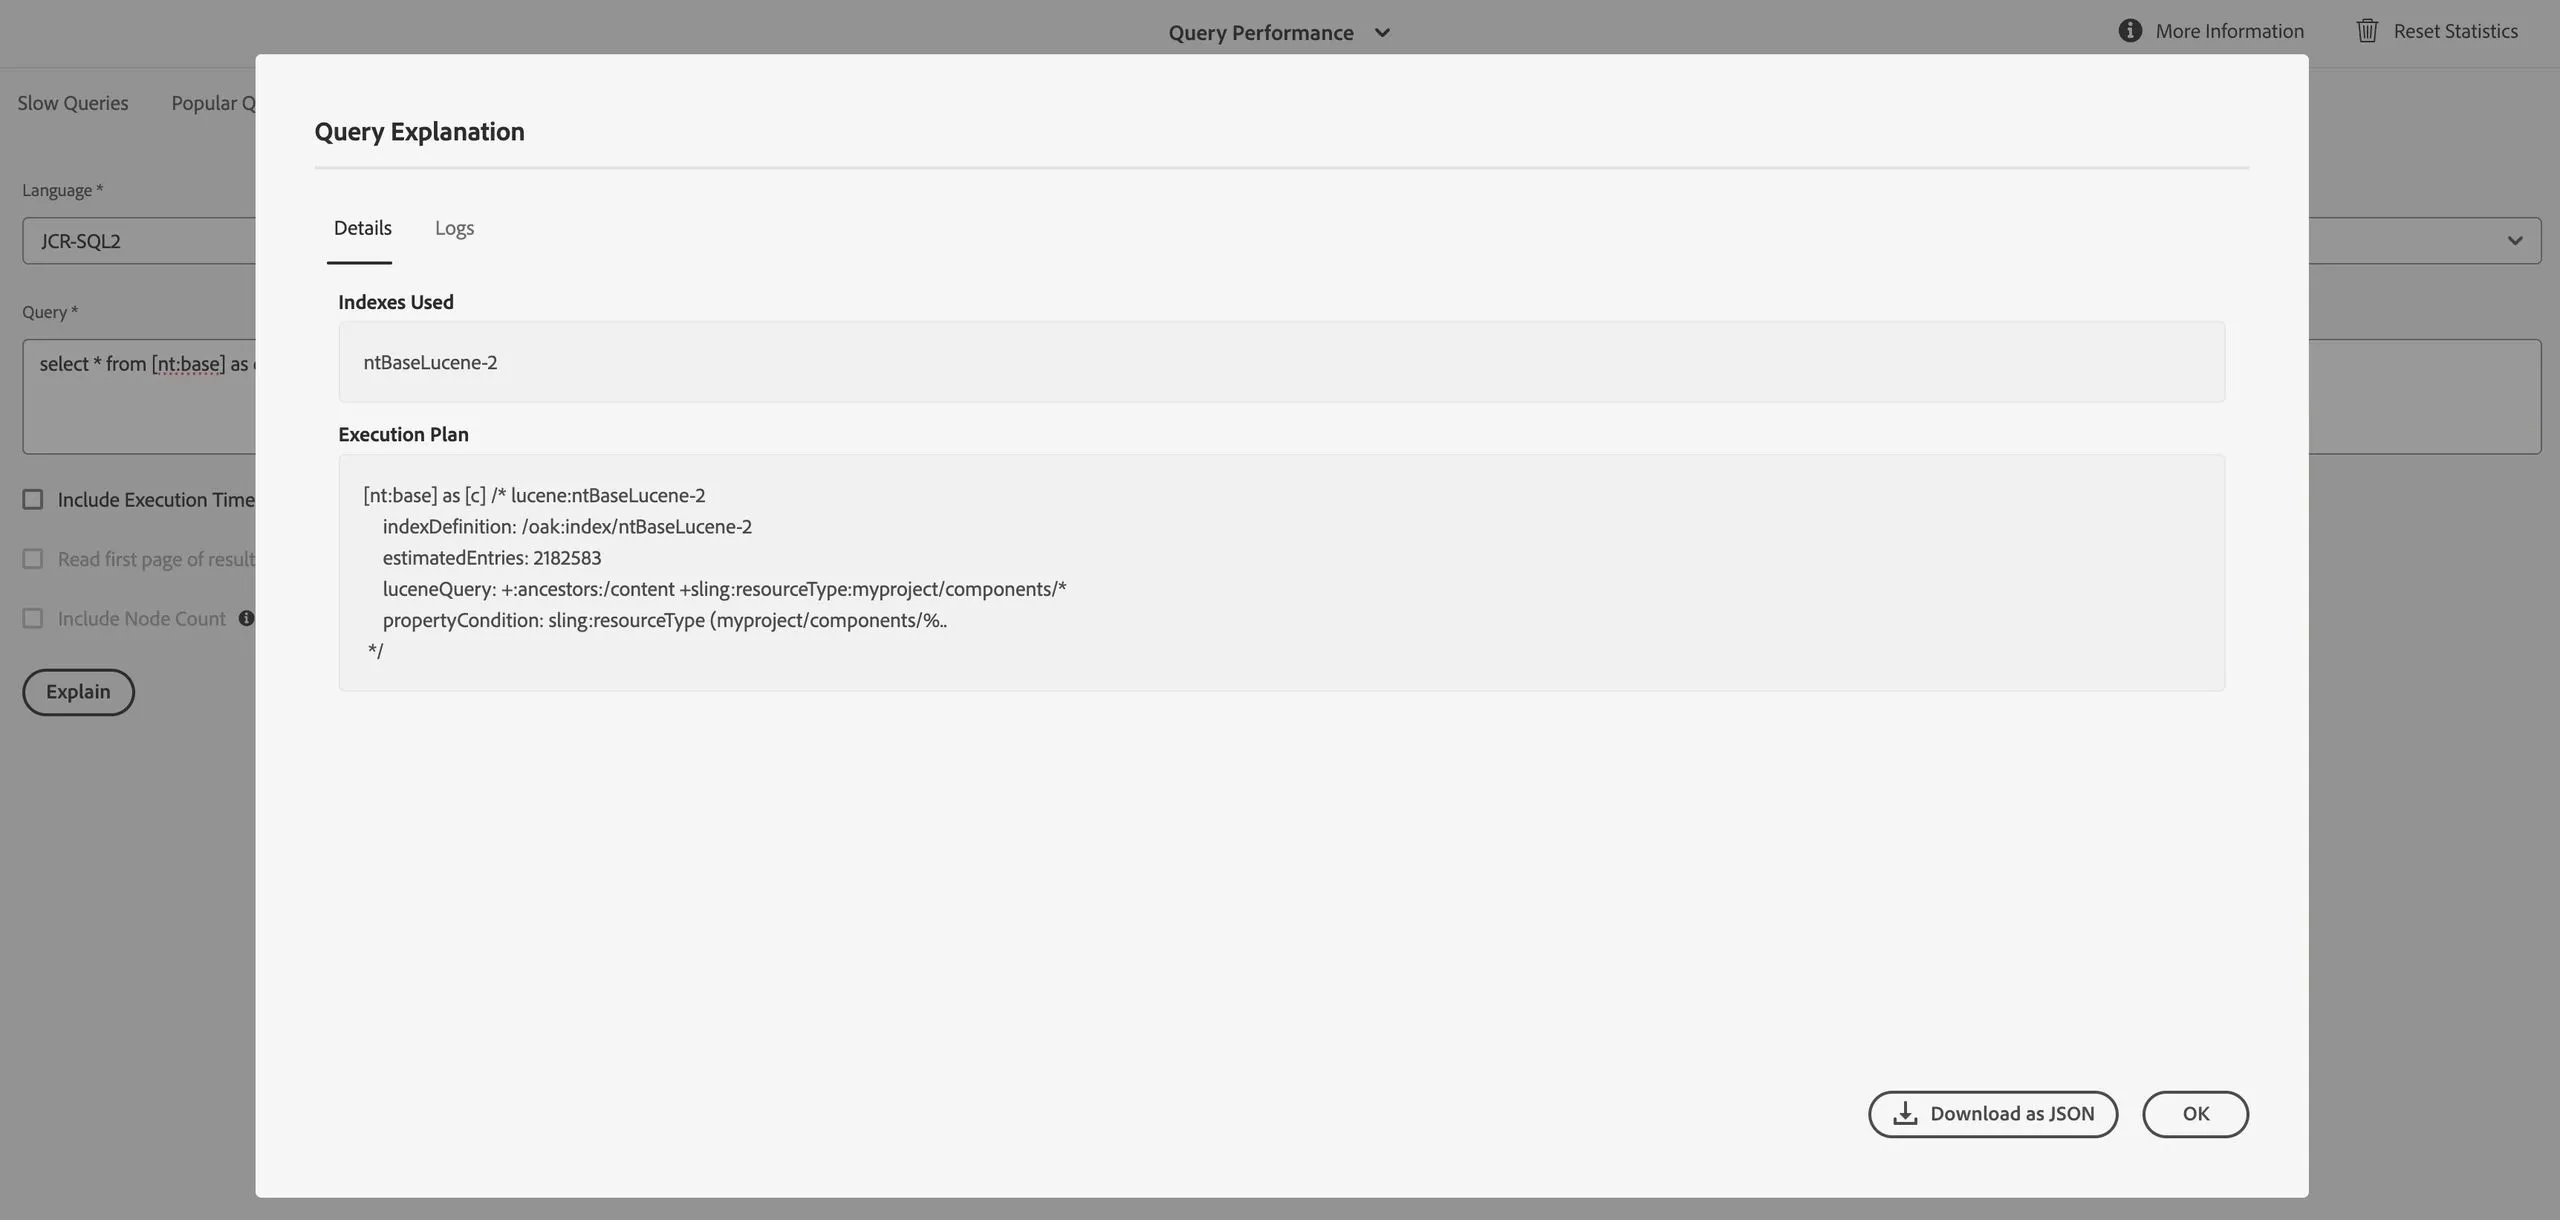
The Query Performance Tool allows us to paste JCR-SQL2 or XPath queries and inspect how they are planned and executed by Oak. When running a query in the Query Performance tool, we can:
- See whether the query uses an index or falls back to traversal
- Identify which index is selected by Oak
- Check estimated and actual costs
- Confirm whether path restrictions are applied
- Validate that a newly added index is being picked up
A traversal-heavy query will typically show:
- no index being selected, or
- a generic index being used with a high estimated cost
After deploying a custom index, the same query should show:
- the custom index name
- a significantly lower estimated cost
- no traversal warnings in the logs
The Query Performance tool is especially useful during development and testing, as it allows teams to verify index usage before code reaches production. It should be part of the standard development workflow whenever new queries are introduced or existing ones are modified.
Leverage Splunk to React Faster
Once traversal issues are detectable and understood, the next step is making them visible over time. This is where centralized observability becomes critical. Splunk, among other tools available that can ingest AEM logs, allows teams to move beyond one-off log inspections and instead track traversal behavior continuously across environments. With the right Splunk queries in place, traversal warnings can be used to create alerts and dashboards. A common first step is creating alerts that trigger when new traversal patterns appear or when node traversal counts spike unexpectedly. Here is an example Splunk query we can use to capture all traversal warnings on production in a single field:
index={replace_with_your_index} aem_env_id={replace_with_your_env_id} sourcetype=aemerror aem_env_type=prod level=WARN aem_tier=author "Index-Traversed"
| rex field=msg "Index-Traversed\s(?<nodes_traversed>\d+)\snodes"
| rex field=msg "(?i)isdescendantnode\s*\(\s*(?:[^,]+,\s*)?['\"](?<search_path>/[^'\")]+)['\"]"
| eval search_path=coalesce(search_path, "/unknown")
| rex field=msg "Filter\(query=(?<query_part>.*?)(?:/\*|$)"
| eval query_part_short=substr(query_part, 1, 100)
| eval base_alert_key="Index-Traversed in ".aem_env_type."/".aem_tier." (env_id: ".aem_env_id.") – ".search_path.". Query: ".query_part_short. "..."
| stats count min(nodes_traversed) as min_nodes max(nodes_traversed) as max_nodes values(pod_name) as pods by base_alert_key
| eval alert_message=base_alert_key." (min ".min_nodes." – max ".max_nodes." nodes traversed - ".count." occurrences)"
| stats values(alert_message) as all_combined_values
| eval msg_override = mvjoin(all_combined_values, "|||")
| rex mode=sed field=msg_override "s/\|\|\|/\n/g"
| fields msg_override
These alerts can be routed directly to operations teams via email or sent to Slack channels, ensuring traversal issues are visible to the team as soon as they occur. Beyond alerts, dashboards make it easier to identify trends and recurring problem areas. The query below is well-suited for dashboards because it produces structured metrics that can be used directly in visualizations:
index={replace_with_your_index} aem_env_id={replace_with_your_env_id} sourcetype=aemerror aem_tier=author level=WARN aem_tier=author "Index-Traversed"
| rex field=msg "Index-Traversed\s(?<nodes_traversed>\d+)\snodes"
| eval nodes_traversed=tonumber(nodes_traversed)
| rex field=msg "(?i)isdescendantnode\s*\(\s*(?:[^,]+,\s*)?['\"](?<search_path>/[^'\")]+)['\"]"
| eval search_path=coalesce(search_path, "/unknown")
| rex field=msg "Filter\(query=(?<query_part>.*?)(?:/\*|$)"
| eval query_part=coalesce(query_part, "unknown-query")
| eval query_part_short=if(len(query_part)>300, substr(query_part, 1, 300)."...", query_part)
| stats
    count as occurrences
    min(nodes_traversed) as min_nodes
    avg(nodes_traversed) as avg_nodes
    max(nodes_traversed) as max_nodes
    p95(nodes_traversed) as p95_nodes
    dc(pod_name) as pod_count
  by search_path query_part_short
| eval avg_nodes=round(avg_nodes, 0), p95_nodes=round(p95_nodes, 0)
| sort -occurrences -max_nodes
| head 10
| fields query_part_short occurrences
Fields such as occurrences can be used to show how often traversal patterns appear, while max_nodes or p95_nodes highlight the most expensive queries. In Splunk dashboards, these fields can be selected as chart values for bar or column visualizations to compare traversal frequency versus impact. This makes it easy to identify both the most common and the most costly traversal queries at a glance.
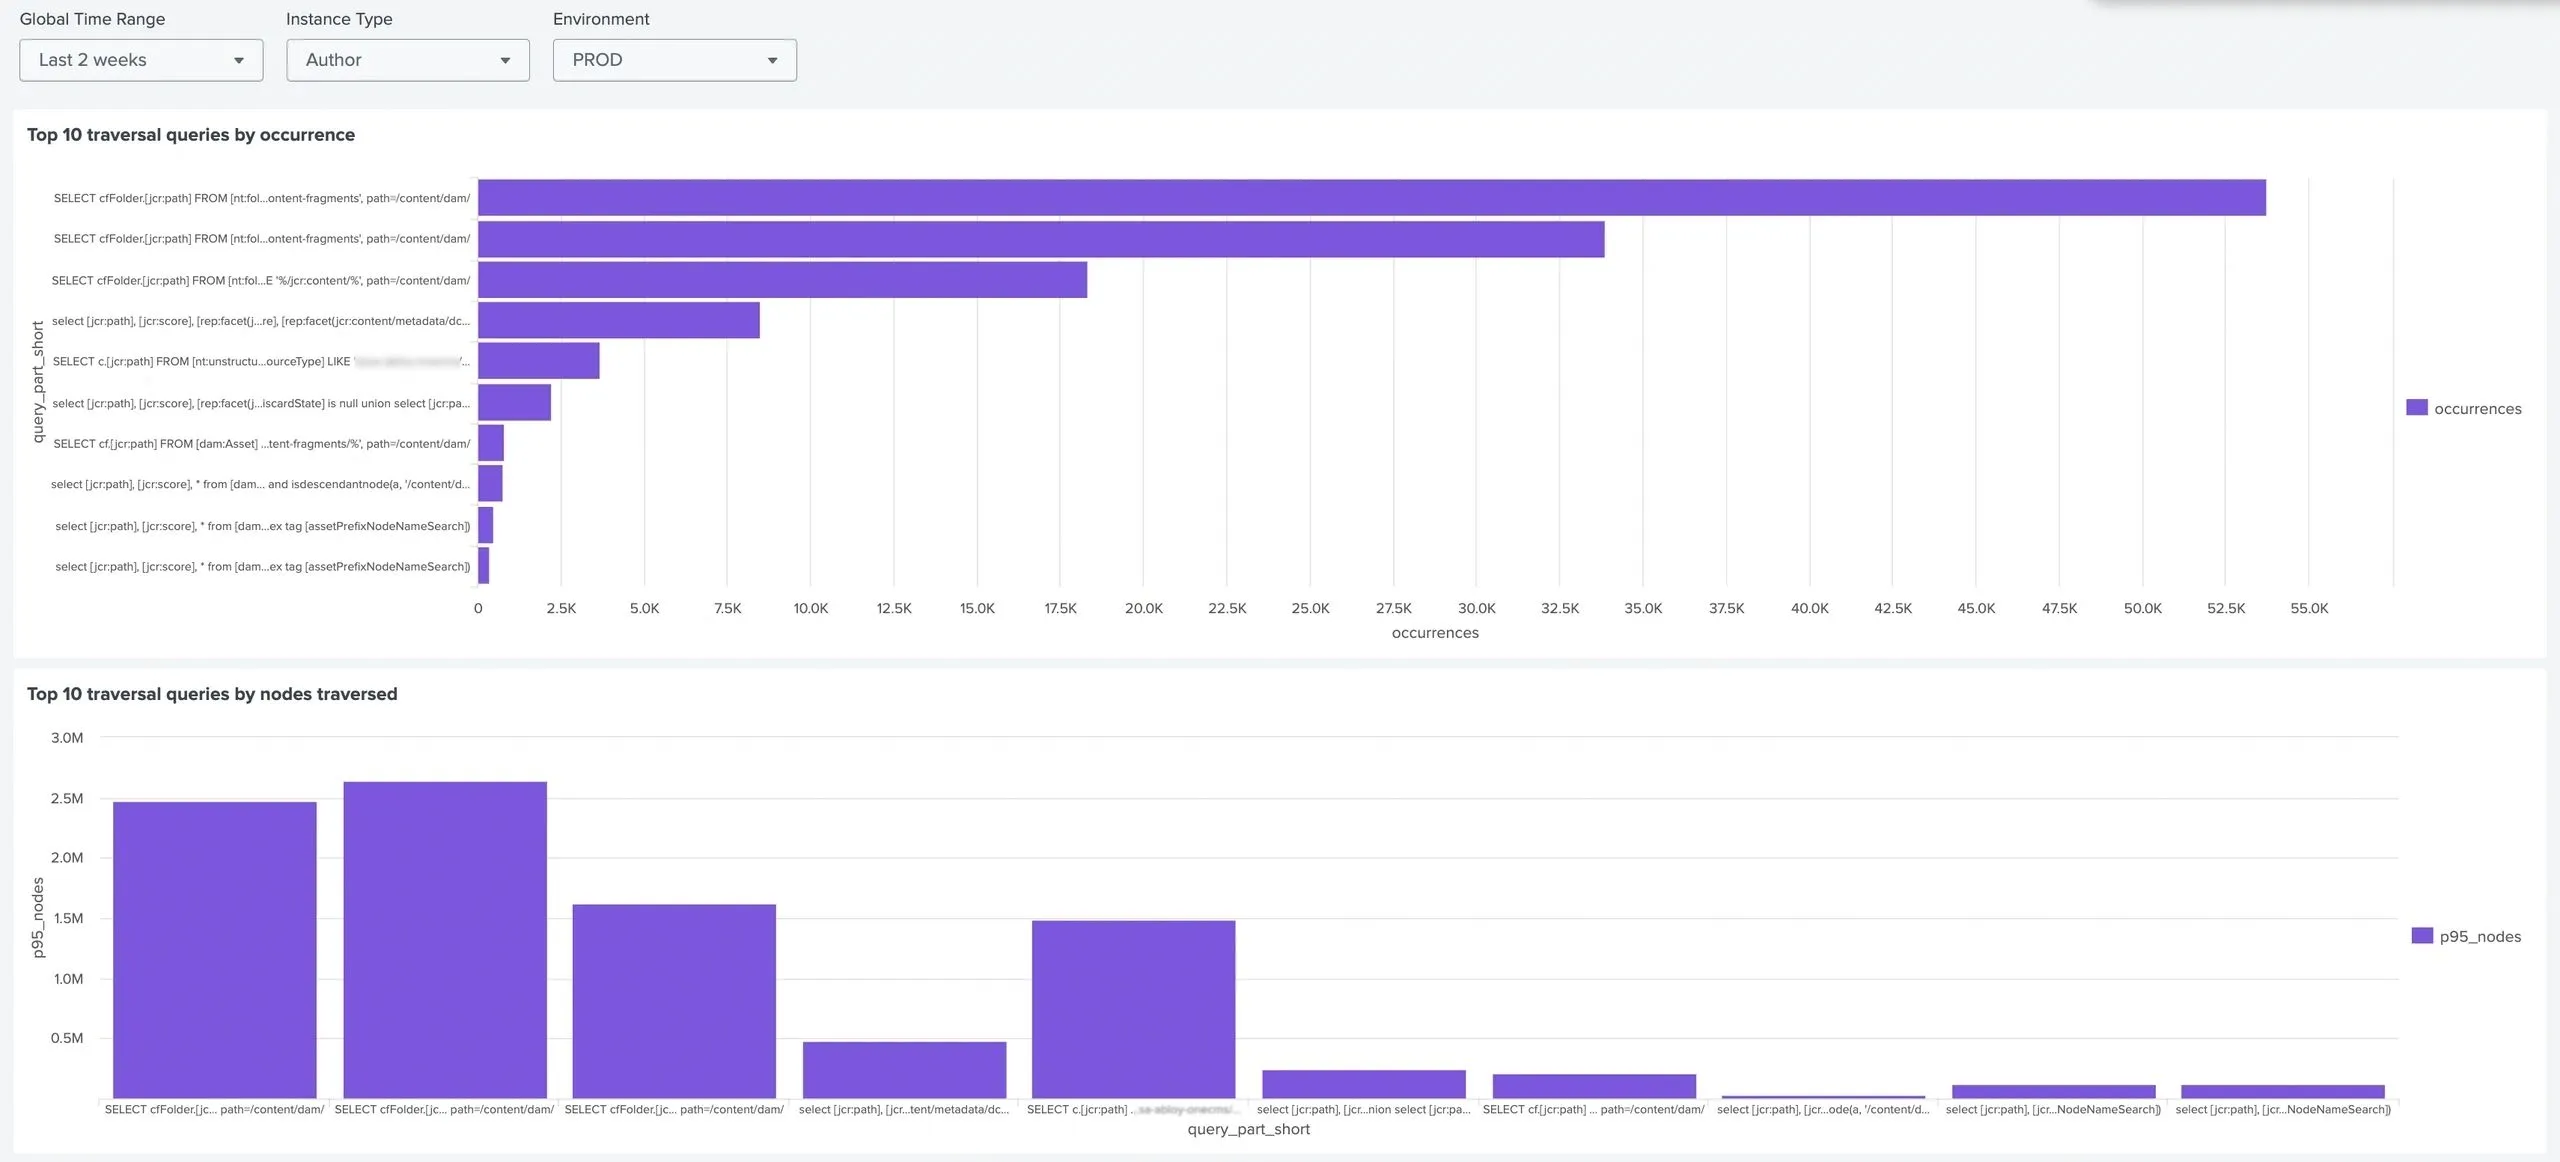
Together, alerts and dashboards provide a clear, data-driven backlog of queries and indexes that require attention, helping teams prioritize fixes before traversal becomes a visible performance issue for editors or end-users.
Conclusion
Index traversal is not a bug; it is Oak telling us that a query has outgrown the indexes available to it. In many cases, it is also a signal that a query may need to be revisited and optimized. The good news is that traversal is visible and fixable. By improving queries where possible, creating focused custom indexes where necessary, and continuously monitoring query behavior, teams can prevent small issues from turning into systemic performance problems. Just as importantly, index traversal should not be treated as a one-off fix. New features, new components, and new queries will continue to appear over the lifetime of an AEM platform. Without proper observability, traversal problems will keep coming back.
Teams that are not monitoring performance and proactively fixing issues like traversal warnings are accepting avoidable risk in their AEM platforms. These problems compound over time and inevitably surface as author slowdowns or production incidents. If that sounds familiar, reach out to us. We help teams regain control of AEM performance through targeted performance analysis, proactive monitoring, and optimization strategies.