Stop Guessing: Visualize AEMaaCS Editor Activity with Splunk
 Daniel Strmečki
When we talk about performance optimization in AEM as a Cloud Service (AEMaaCS), we usually focus on Dispatcher caching, CDN configuration, frontend performance, query indexing or backend refactoring. What often gets overlooked is the actual editor activity on the Author environment. Knowing how, when, and how intensely editors use AEM Author is critical operational information. Heavy editorial activity can significantly impact Author performance without proper optimizations in place, especially during peak hours. Conversely, periods of low editor activity present ideal windows for running content cleanup jobs, bulk imports, reindexing, or maintenance tasks that would otherwise degrade the editor experience.
In this post, we’ll walk through how to build a Splunk dashboard to gain clear visibility into editor behavior on AEMaaCS Author. The goal of the dashboard is simple: to understand editor usage patterns, identify peak and low-activity periods, quantify how editors interact with pages and assets, and highlight content hotspots. All of this data is derived from AEM Author access logs and visualized in Splunk, giving both developers and operations teams actionable insights instead of gut feelings.
Dashboard Overview
The dashboard is designed to answer a few core questions: how many editors are active at any given time, when activity peaks during the day, whether a small number of power users are responsible for most of the load, whether editors mainly work with pages or assets, and which content areas receive the most attention.
From a setup perspective, we’ll build this dashboard step by step, using Splunk’s standard dashboard features. Creating a new dashboard itself is a matter of just a few clicks in the Splunk UI and doesn’t require any special explanation. We start by identifying the AEM Author access logs as the data source and validating that editor‑identifying information (such as user IDs or authenticated principals) is available. This is the foundation for everything that follows. From there, each metric is implemented as an individual dashboard panel using a Splunk query.
Each panel focuses on a single question and relies on Splunk’s Global Time Range, which means the same queries can be reused for any time window. This allows dashboard users to switch between last hour, last day, or last week without changing the underlying queries, making comparisons and investigations much easier. We typically build and validate each query in Splunk Search first. Once the results look correct, we save the query as a visualization and add it to the dashboard. We repeat this process panel by panel, effectively building the dashboard together as we go. This iterative approach makes it easy to refine queries and adjust visualizations as new questions come up.
Total Number of Editors
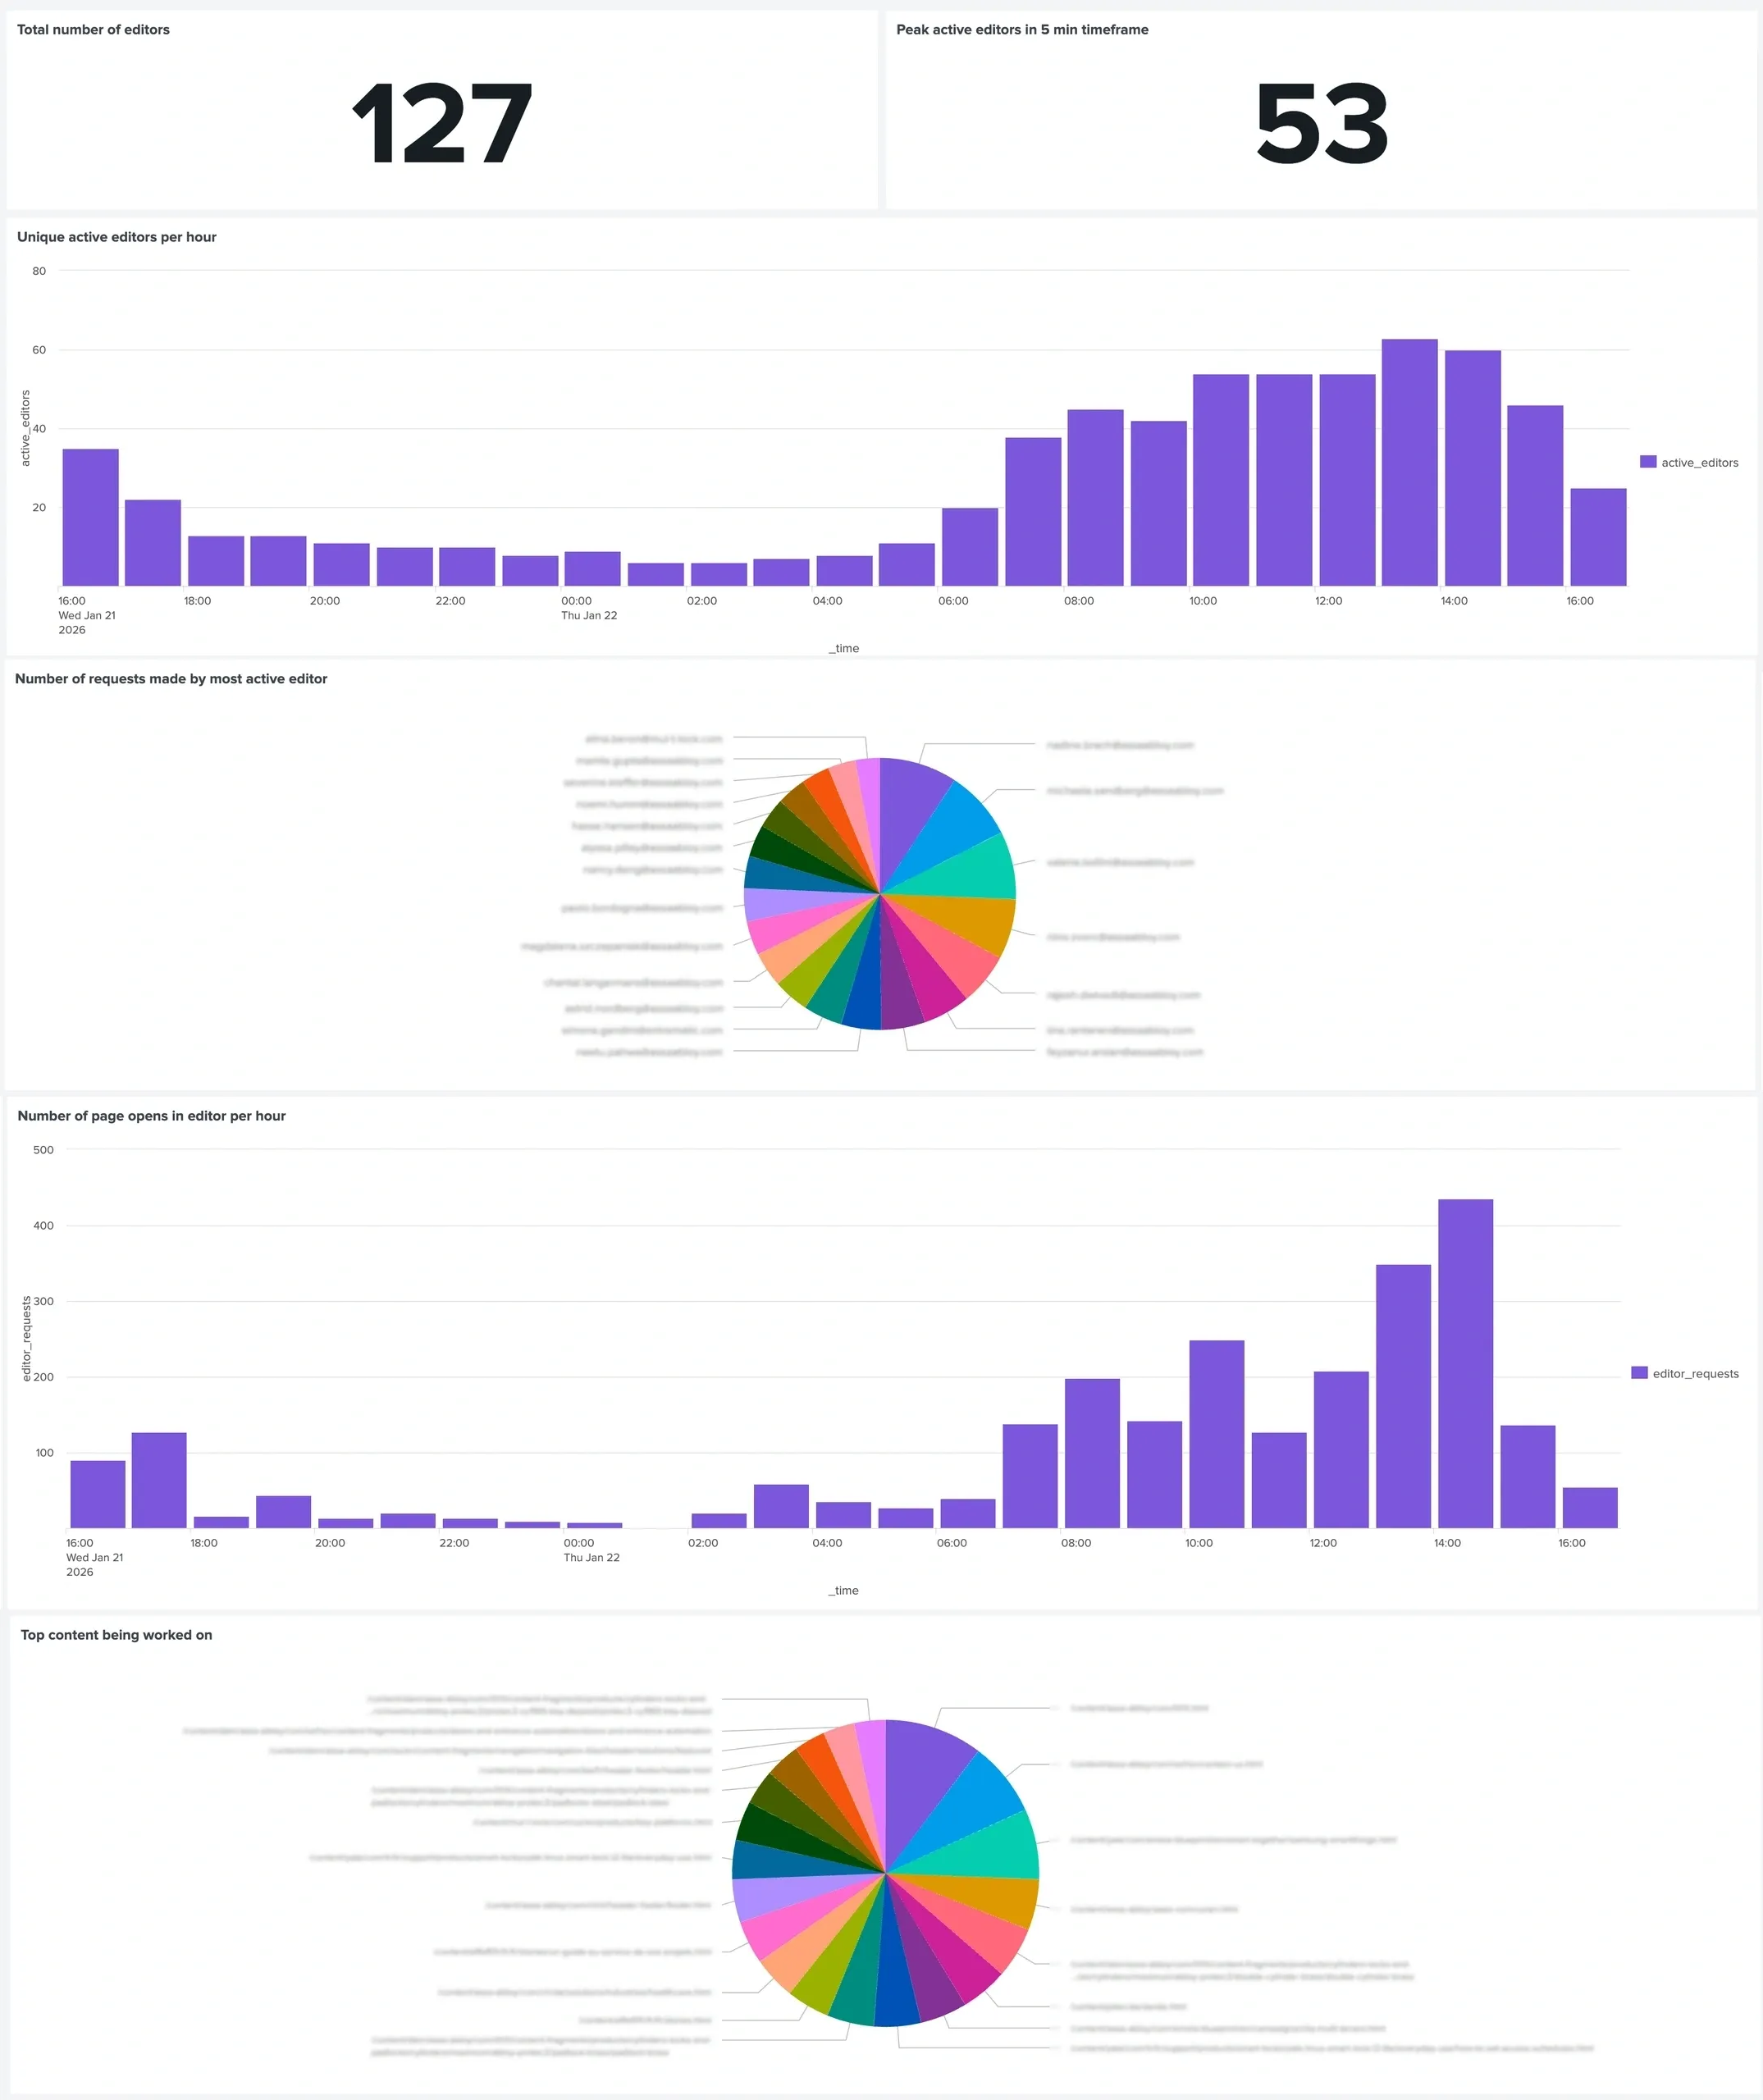
Our first panel answers a fundamental question: how many unique editors are using AEM Author within the selected time range? It gives us a high‑level view of editorial reach and helps establish a baseline for how many people are actively working in Author during a given period. This is useful when comparing different days, weeks, or campaign phases.
index={replace_with_your_index} aem_env_id={replace_with_your_env_id} sourcetype=aemaccess aem_tier=author (method=GET OR method=POST)
| where user!="" AND user!="anonymous" AND user!="admin" AND user!="-" AND NOT like(user,"oauth%")
| stats dc(user) AS total_unique_editors
Peak Active Editors
While total editor count shows overall reach, it doesn’t tell us anything about concurrency. Our next panel focuses on how many editors are active at the same time, using 5‑minute time buckets. By looking at short time windows, we can identify brief spikes in activity that are easy to miss in hourly or daily averages. This is especially valuable when correlating editor complaints or performance issues with real load on the Author instance. Typical use cases include detecting unexpected spikes in author activity, validating whether reported performance issues align with actual editor load, and defining what “normal” peak concurrency looks like for your Author environment.
index={replace_with_your_index} aem_env_id={replace_with_your_env_id} sourcetype=aemaccess aem_tier=author (method=GET OR method=POST)
| where user!="" AND user!="anonymous" AND user!="admin" AND user!="-" AND NOT like(user,"oauth%")
| timechart span=5m dc(user) AS active_editors
| stats max(active_editors) AS peak_active_editors
Unique Active Editors per Hour
While peak concurrency is useful, it doesn’t tell the full story. This panel focuses on how many distinct editors are active each hour. This metric helps identify broader usage patterns across the day, such as clear working hours versus off‑hours, differences between regions or teams, and whether author activity follows standard business hours or content deadlines. It’s particularly valuable when planning disruptive operations like bulk imports or package installs, where even a small number of active editors should be avoided.
index={replace_with_your_index} aem_env_id={replace_with_your_env_id} sourcetype=aemaccess aem_tier=author (method=GET OR method=POST)
| where user!="" AND user!="anonymous" AND user!="admin" AND user!="-" AND NOT like(user,"oauth%")
| timechart span=1h dc(user) AS active_editors
Number of Requests by the Most Active Editors
Not all editors generate the same load. This panel highlights the most active editors in a given time range by counting how many requests each editor generates. This insight helps identify power users such as content leads or migration users, spot unusual behavior that may indicate automation or misuse, and understand how skewed editor load distribution really is. In practice, it’s common to see a small number of editors responsible for a disproportionately large share of Author traffic. To build this panel, we aggregate requests by user, sort them by volume, and then focus on the top results. Displaying the top 10 or 20 editors usually provides enough insight without overwhelming the dashboard.
index={replace_with_your_index} aem_env_id={replace_with_your_env_id} sourcetype=aemaccess aem_tier=author (method=GET OR method=POST)
| where user!="" AND user!="anonymous" AND user!="admin" AND user!="-" AND NOT like(user,"oauth%")
| stats count AS requests by user
| sort -requests
| head 20
Page Opens per Hour
This panel focuses specifically on page opens in the AEM editor, which are a strong indicator of active content authoring. Page opens are typically more expensive than simple navigation requests, as they involve loading editor frameworks, content structure, and related metadata. Tracking this metric hourly helps us understand when authoring activity is most intense and when Author load is likely to peak. To build this panel, we filter for editor page requests and group them into one-hour buckets.
index={replace_with_your_index} aem_env_id={replace_with_your_env_id} sourcetype=aemrequest aem_tier=author path="/editor.html/*"
| timechart span=1h count AS editor_requests
Top Content Being Worked On
Our next panel answers the question: what content is receiving the most editor attention? By aggregating editor interactions by content path, we can identify frequently edited pages or sections, content hotspots during campaigns or launches, and areas that may benefit from refactoring or structure improvements. This data is also useful outside of pure performance concerns, for example when collaborating with content teams to understand editorial focus. To build this panel, we focus on editor page requests, extract the actual content path being edited, and then aggregate interactions by that target. Looking at the top 10 or 20 entries usually provides enough insight without overwhelming the dashboard.
index={replace_with_your_index} aem_env_id={replace_with_your_env_id} sourcetype=aemaccess aem_tier=author (method=GET OR method=POST) path="/editor.html/*"
| where user!="" AND user!="anonymous" AND user!="admin" AND user!="-" AND NOT like(user,"oauth%")
| eval editor_target=replace(path,"^/editor\\.html","")
| stats count AS editor_requests by editor_target
| sort -editor_requests
| head 20
Asset Opens per Hour
While page editing drives most Sites-related load, asset interactions can be just as impactful in DAM-heavy environments. This panel tracks asset opens in the editor per hour. Separating asset activity from page authoring helps us understand whether performance pressure comes primarily from Sites, Assets, or a mix of both. It also helps identify periods where asset-heavy workflows, such as uploads or metadata updates, dominate editor activity. To build this panel, we focus on requests to the Assets console and group them into one-hour buckets. This gives us a clear view of when DAM usage is highest.
index={replace_with_your_index} aem_env_id={replace_with_your_env_id} sourcetype=aemaccess aem_tier=author method=GET (path="/assets.html/*")
| where user!="" AND user!="anonymous" AND user!="admin" AND user!="-" AND NOT like(user,"oauth%")
| timechart span=1h count AS asset_console_opens
Conclusion
Without visibility into editor activity, performance optimization on Author is mostly guesswork. By visualizing editor activity in AEM as a Cloud Service, we move from assumptions to facts. Instead of guessing when the AEM Author is under pressure or when it’s safe to run disruptive operations, we can base those decisions on real usage data.
The dashboard we built is intentionally simple, but highly effective. It turns raw access logs into concrete insights and shows who is active, when activity peaks, how editors interact with pages and assets, and which content areas receive the most attention. With Splunk’s Global Time Range and other input fields, we can simply drag and drop; the same panels can be used to check author activity on multiple environments. They can be used for investigating a short incident window or identifying long‑term usage patterns.
Most importantly, this approach helps teams align technical decisions with editorial reality. Maintenance windows, background jobs, and performance optimizations can be planned around actual editor behavior, not assumptions. Over time, this leads to a more stable Author environment and a better experience for the people who rely on it every day.
If you want to take this further and ensure your AEM as a Cloud Service setup consistently performs at its best, we can help. From analyzing Author and Publish performance to optimizing editorial workflows and operational processes, our consulting services are focused on making AEMaaCS work efficiently at scale. Get in touch if you’d like to turn insights into concrete performance improvements.