Daniel Strmečki
Performance testing is usually recommended before going live or even better continuously before promoting each new release. Even though I am not an expert on the topic, I've seen many performance tests passing only because they are testing the wrong thing, not using a big enough data set, or not mimicking the real production traffic. Therefore, I've decided to share my experience in writing performance tests for AEMaaCS with a tool from Grafana called K6.
K6 is an open-source tool focused on performance testing web applications and APIs. It is designed to help us evaluate and ensure systems' performance, scalability, and reliability by simulating user behavior and generating traffic to measure system response under stress.
The first thing we might notice about K6 is that it is very easy to use. We can probably write our first test using JavaScript in just a few minutes. However, in this article, we will take a step-by-step approach and consider a few questions one should consider before actually writing a performance test.
Note that there are many different types of performance tests. In this article, we cover only the most common one, which is load testing. The goal of load testing is to evaluate how a system performs under expected, normal, or anticipated user loads. It aims to ensure that the system can handle its regular workload effectively and maintain performance within acceptable limits. Other types of performance testing out of the scope of this article include stress, spike, and endurance testing.
What to Test?
AEMaaCS as a product is usually a combination of Adobe's framework, as well as OOTB features and custom extensions. Adobe is responsible for performance testing the framework core and the features they develop, and they do so. On the other hand, as developers who customize AEM, we should focus on performance testing our customizations and extensions.
Here are a few examples of extensions that usually make sense to cover with performance tests:
- Custom APIs / Sling servlets
- Custom pages and components
- Custom error pages
- Custom sitemaps
There could be many more examples depending on what we customize on a specific project. However, note the word "custom" is always the first one used. Believe it or not, most often our customizations are causing performance issues, not the Adobe OOTB features. In case we do find a performance issue with Adobe OOTB features, we can always report it to their support teams.
Where to Test?
Running our AEMaaCS performance tests on Production is usually not a good idea as it could negatively affect performance for real users. On the other hand, running them on Dev environments could lead to significant differences in results compared to Production due to the different configurations like autoscaling. Therefore, running performance tests on the Stage environment is our best option. The Stage environment is kept at the same sizing as the Production environment. However, it might require a warmup phase, as it can take some time until the Stage environment gets upscaled to the same instances as Production.
As we have selected the Stage environment for performance testing, we still need to decide what instance type to target. Usually, performance tests are executed only on Publisher as we aim to ensure good performance for end users. However, we can also set up a few editor-specific tests to run on the Author instance. When testing a Publisher URL on AEMaaCS, we will most likely not hit the origin server with each request. There are always two levels of cache in front of AEM Publisher: Apache with Dispatcher and Fastly CDN. The simplest way to bypass both cache layers and ensure each performance test request hits our origin server is to use a query parameter. Note that this might require some additional configuration in Dispatcher or CDN.
On What Content to Test?
Testing performance on a small amount of content will not provide us with useful insights. Therefore, it is important to prepare proper content for performance testing. To achieve that, there are two possible options:
- Pull real content from production using Content backflow
- Create production-like dummy content using custom scripts
Using the first option is easier and good to start with, but it might cause problems later in case we need to refresh the data for regression testing or other purposes. Updating the Stage environment with fresh Production content might cause some checks to fail in our tests. Therefore, in the long term, the second option might be better. We can create static, dummy content mimicking the amount of production data or even doubling the size. It is a good strategy to base performance tests on data that doesn't change unless we really want it to.
Generating such high amounts of data can be a challenge but achievable using custom scripts. For example, a small Node.js application using the Faker library can generate the test data in JSON format. Then, we can push the generated data to Stage using the OOTB Sling Post Servlet option to import JSON structures in JCR.
What Traffic to Target?
Alright, so now we know what features/extensions we want to test and on which environment/URL. We also prepared the test data to mimic the amount of data we have on Production. But, how do we determine the target traffic we should generate in our performance tests? The answer is to look at the Production logs to determine the actual traffic and maybe even double it for load-testing purposes. In case we have Splunk log forwarding set up, we can make use of the following query to determine the actual production traffic.
index=replace_with_your_index sourcetype=aemrequest aem_env_id=your_production_env_id aem_tier=publish path="*\/my-custom-api.json*"
| timechart span=1s count as "# Requests per Second"
| sort -"# Requests per Second"
| head 10
Let's consider an example where the previous query returned a maximum number of 100 requests per second on Production for the /my-custom-api.json path in the last month. We might still want to double that and target 200 requests per second in our performance test.
Achieving 200 requests per second with K6 seems quite simple using the below example test configuration with the constant-arrival-rate executor and rate of 200 with a time unit of 1 second. However, we also need to consider the amount of Virtual Users (VUs).
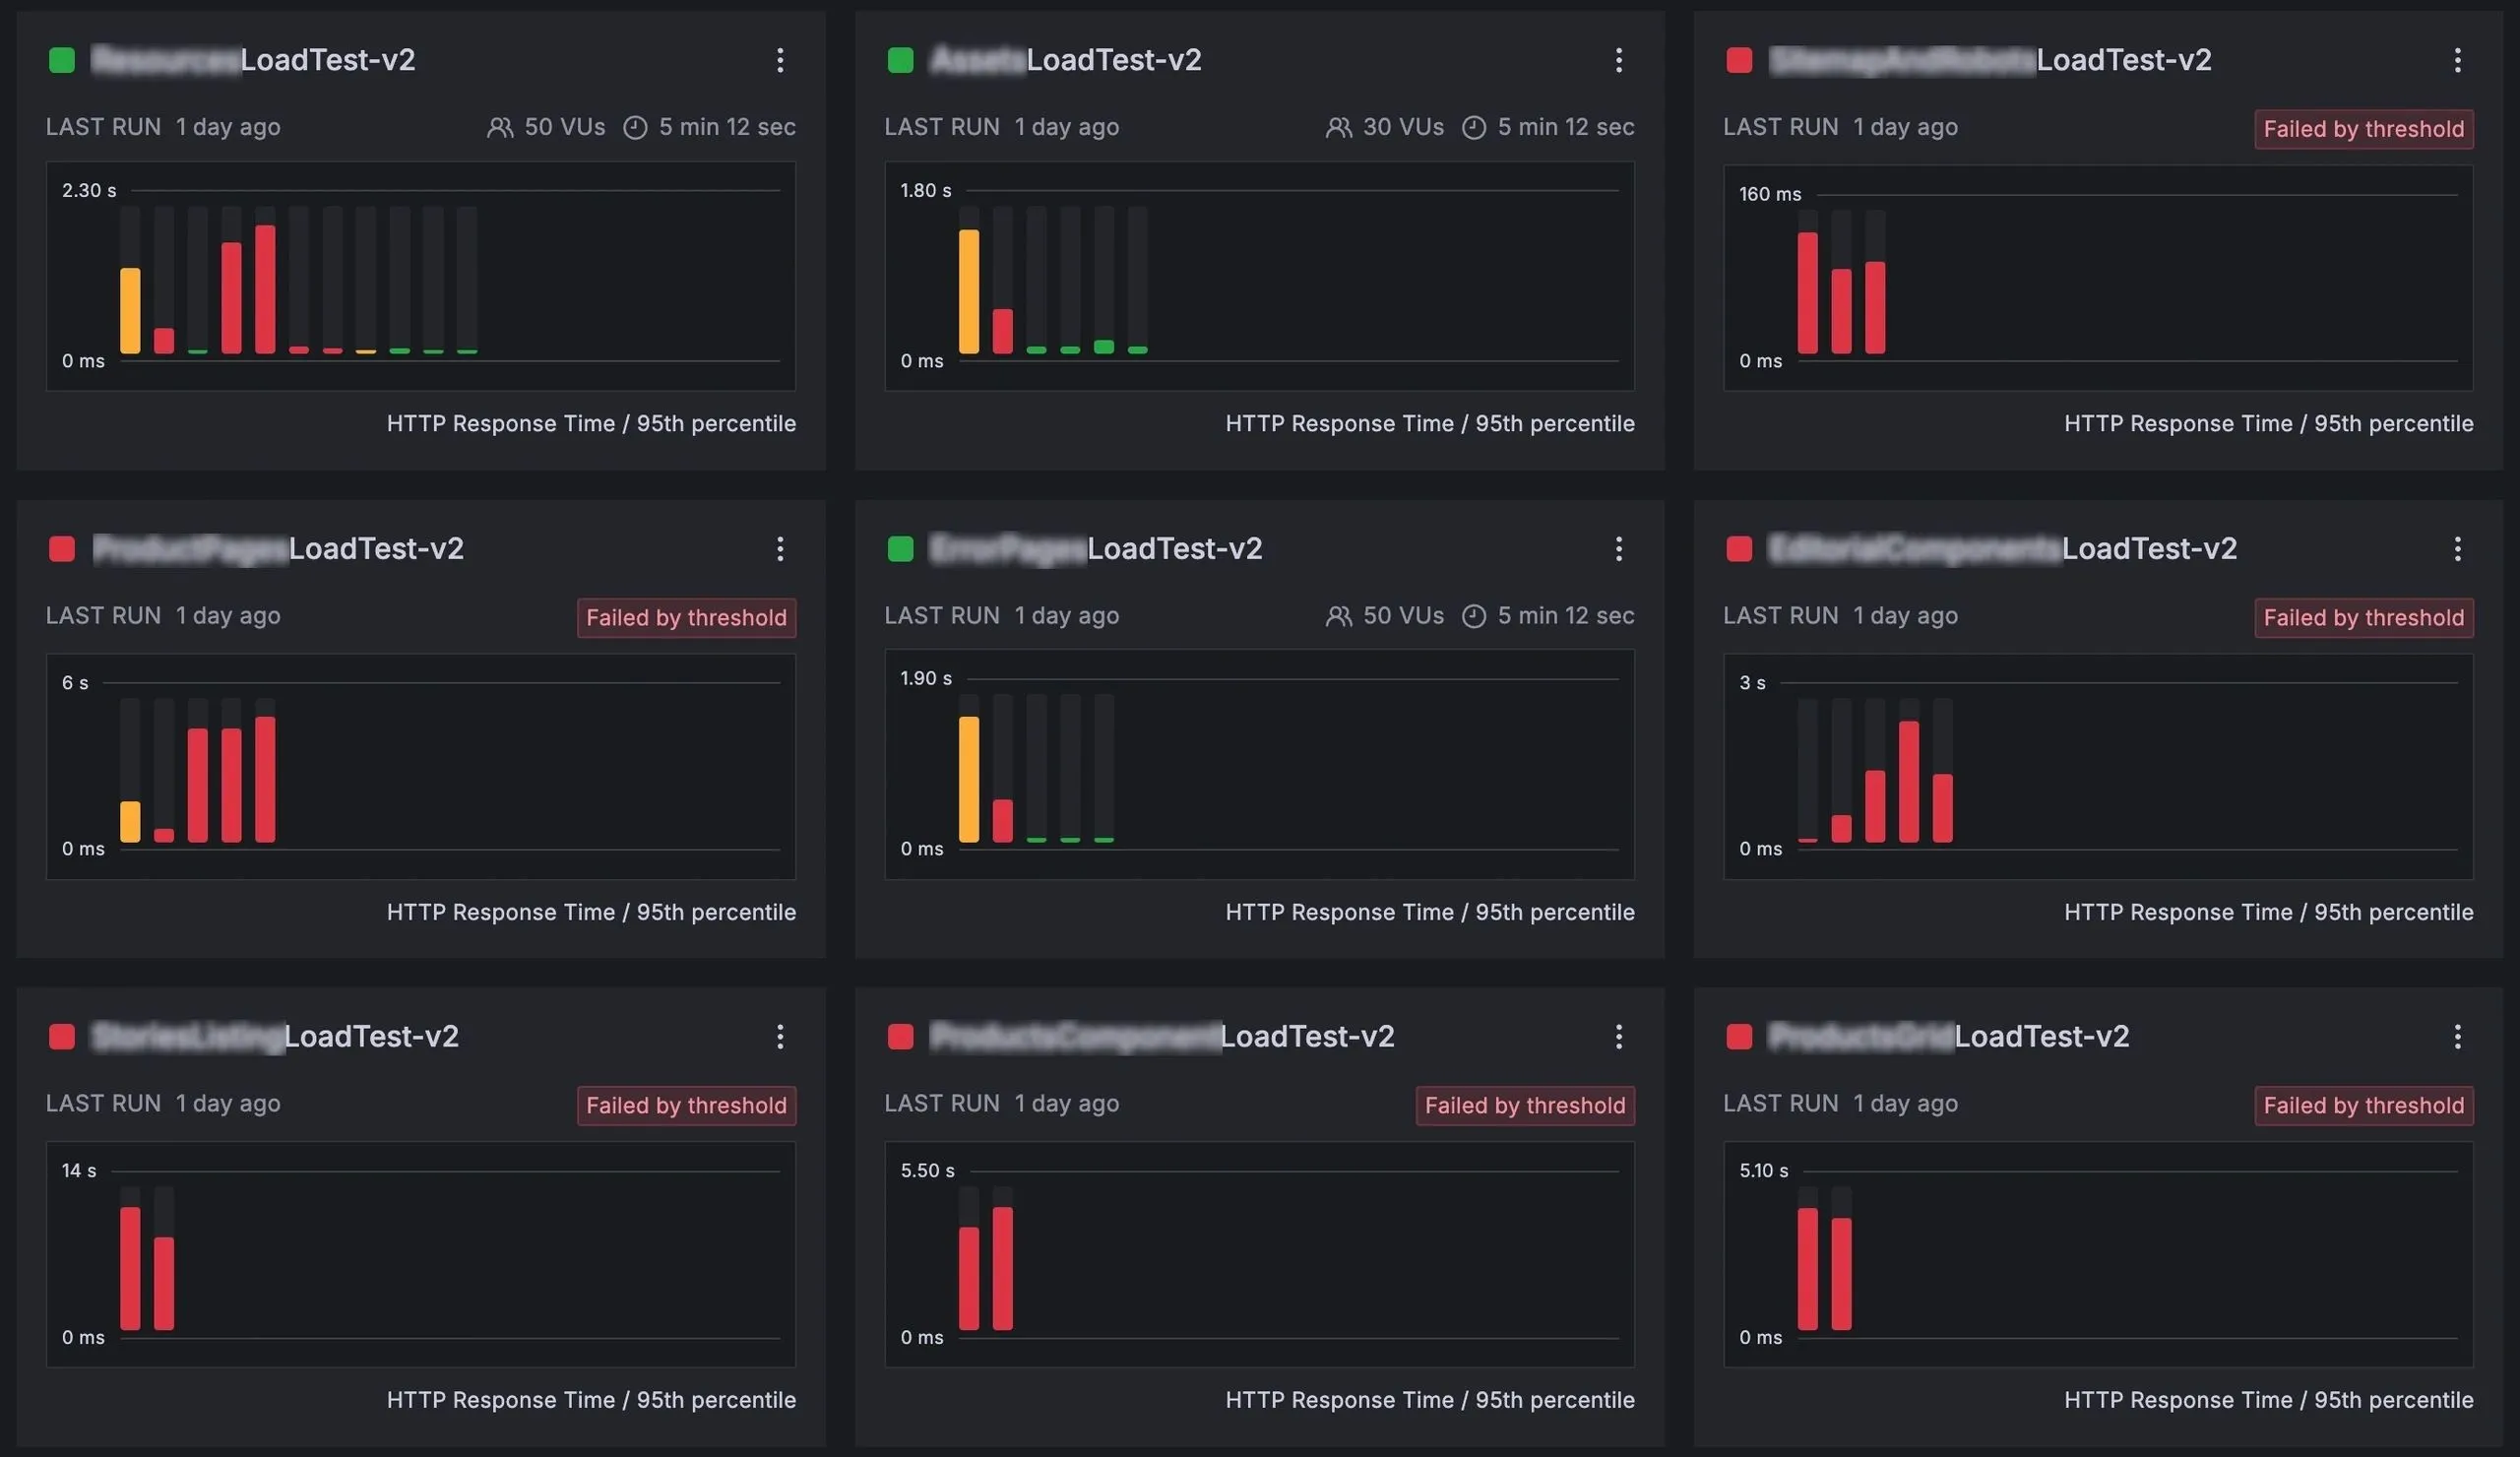
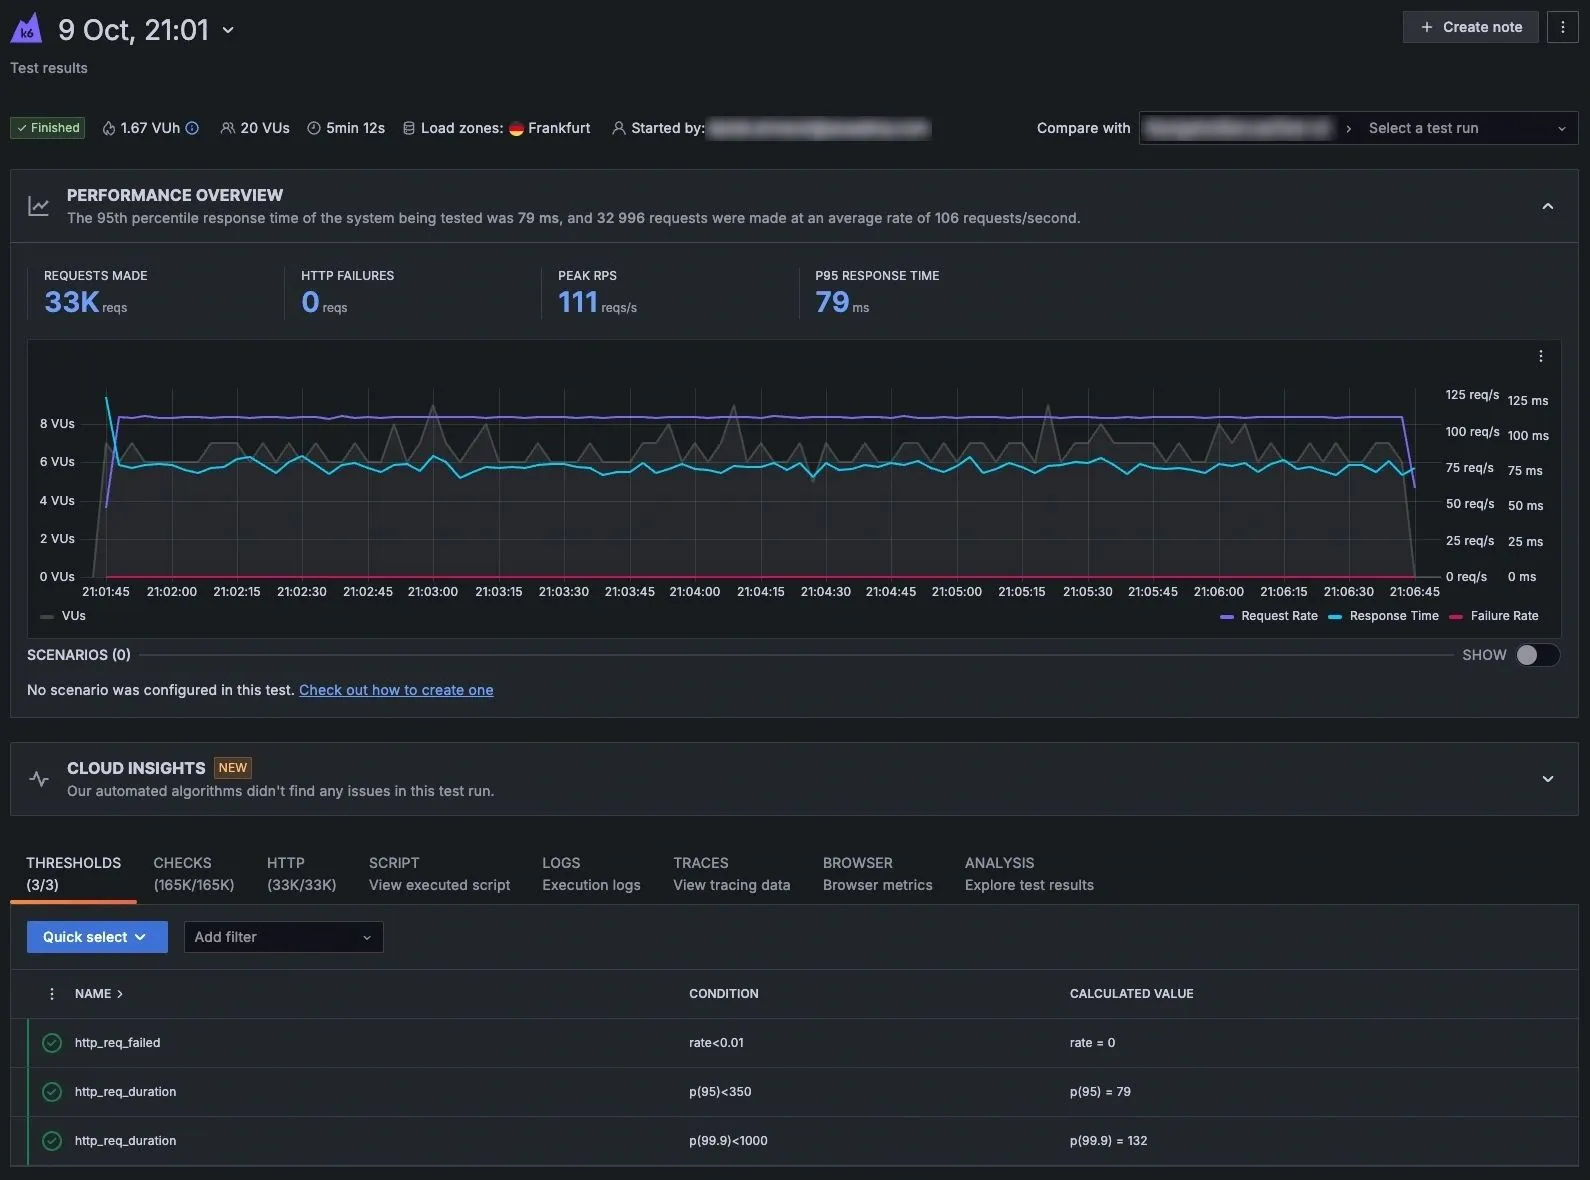
In K6, VUs represent simulated users that perform actions on the system being tested. Each VU runs in parallel and makes requests. Determining the amount of VUs we need for our tests to achieve 200 requests per second is a little tricky, as it depends on the API response time. As each VU will wait for the response from the API, we will need a smaller number of VUs to achieve the desired number of requests per second for a fast API compared to a slow one. As K6 doesn't allow us to control requests per second directly, we can simply run a test without limiting the number of VUs too much and check the K6 dashboard for the achieved peak requests per second.
export const options = {
    cloud: {
        name: 'MyCustomApiPerformanceTest',
        distribution: {
            distributionLabel1: { loadZone: 'amazon:de:frankfurt', percent: 100 }
        }
    },
    thresholds: {
        http_req_failed: ['rate<0.01'], // http errors should be less than 1%
        http_req_duration: ['p(95)<350', 'p(99.9)<700'], // 95% of requests should be below 350ms, 99.9% of requests should be below 700ms
    },
    scenarios: {
        default: {
            executor: 'constant-arrival-rate',
            rate: 200,
            timeUnit: '1s',
            duration: '5m',
            preAllocatedVUs: 5,
            maxVUs: 20,
        },
    }
};
How to Write a Test?
Finally, we come to the easy part, which is to write our K6 load test scenario in JavaScript. It's a standard HTTP request with instructions for VUs to perform custom checks to validate the response. The following example checks for HTTP response status OK and validates the received JSON response data. Note that we use constant variables for the environment URL and query parameter so that we can easily change it in all tests in case we want to target a different environment.
export class MyCustomApi {
    static testApi() {
        const req = http.get(`${url}/rest/api/v1/my-custom-api.json${queryParam}`, params);
        check(req, {
            'Response status was 200': (res) => res.status === 200,
            'Response content-type is application/json': (res) => res.headers['Content-Type'] === 'application/json',
            'Items total count is greater than zero': (res) => res.json().itemsTotalCount > 0,
            'Items total count is equal to the number of items received': (res) => {
                const jsonRes = res.json();
                return jsonRes.itemsTotalCount === jsonRes.items.length;
            },
            'All items contain ID and title attributes': (res) => {
                return res.json().items.every(item => item.id && item.title);
            }
        })
    }
}
Do I Need a License?
The last topic I would like to cover here is licensing, as K6 is available in both open-source/free and Cloud/paid versions. The open-source version is available under the AGPLv3 license, so we are free to use it. However, that also means we will need our own infrastructure for running the tests. Keep in mind that achieving a high number of requests per second is usually not possible on local machines due to network limitations.
On the other hand, the cloud/paid service allows for large-scale tests running on Grafana's infrastructure. It also offers features like distributed load testing, much better result visualization, and team collaboration. Therefore, the decision on the licensing should be based on the actual traffic, available budget, and in-house DevOps skills and resources.
Conclusion
In this article, we covered writing load tests for AEMaaCS Publisher using Grafana K6. There are of course other tools on the market like JMeter, Gatling, or Locust we can use for the same purpose. However, the same principles explained throughout the article should be applied. Before actually writing performance tests we should prepare good answers on what features to test, which environment to use, which content to use, and what traffic to target. Ensuring those are covered well will also ensure our test results provide valuable and actionable insights.